We are celebrating 15 years — and counting — of stories that are deeply researched and deeply felt, that build a historical record of what the city has been.
We are celebrating 15 years — and counting — of stories that are deeply researched and deeply felt, that build a historical record of what the city has been.
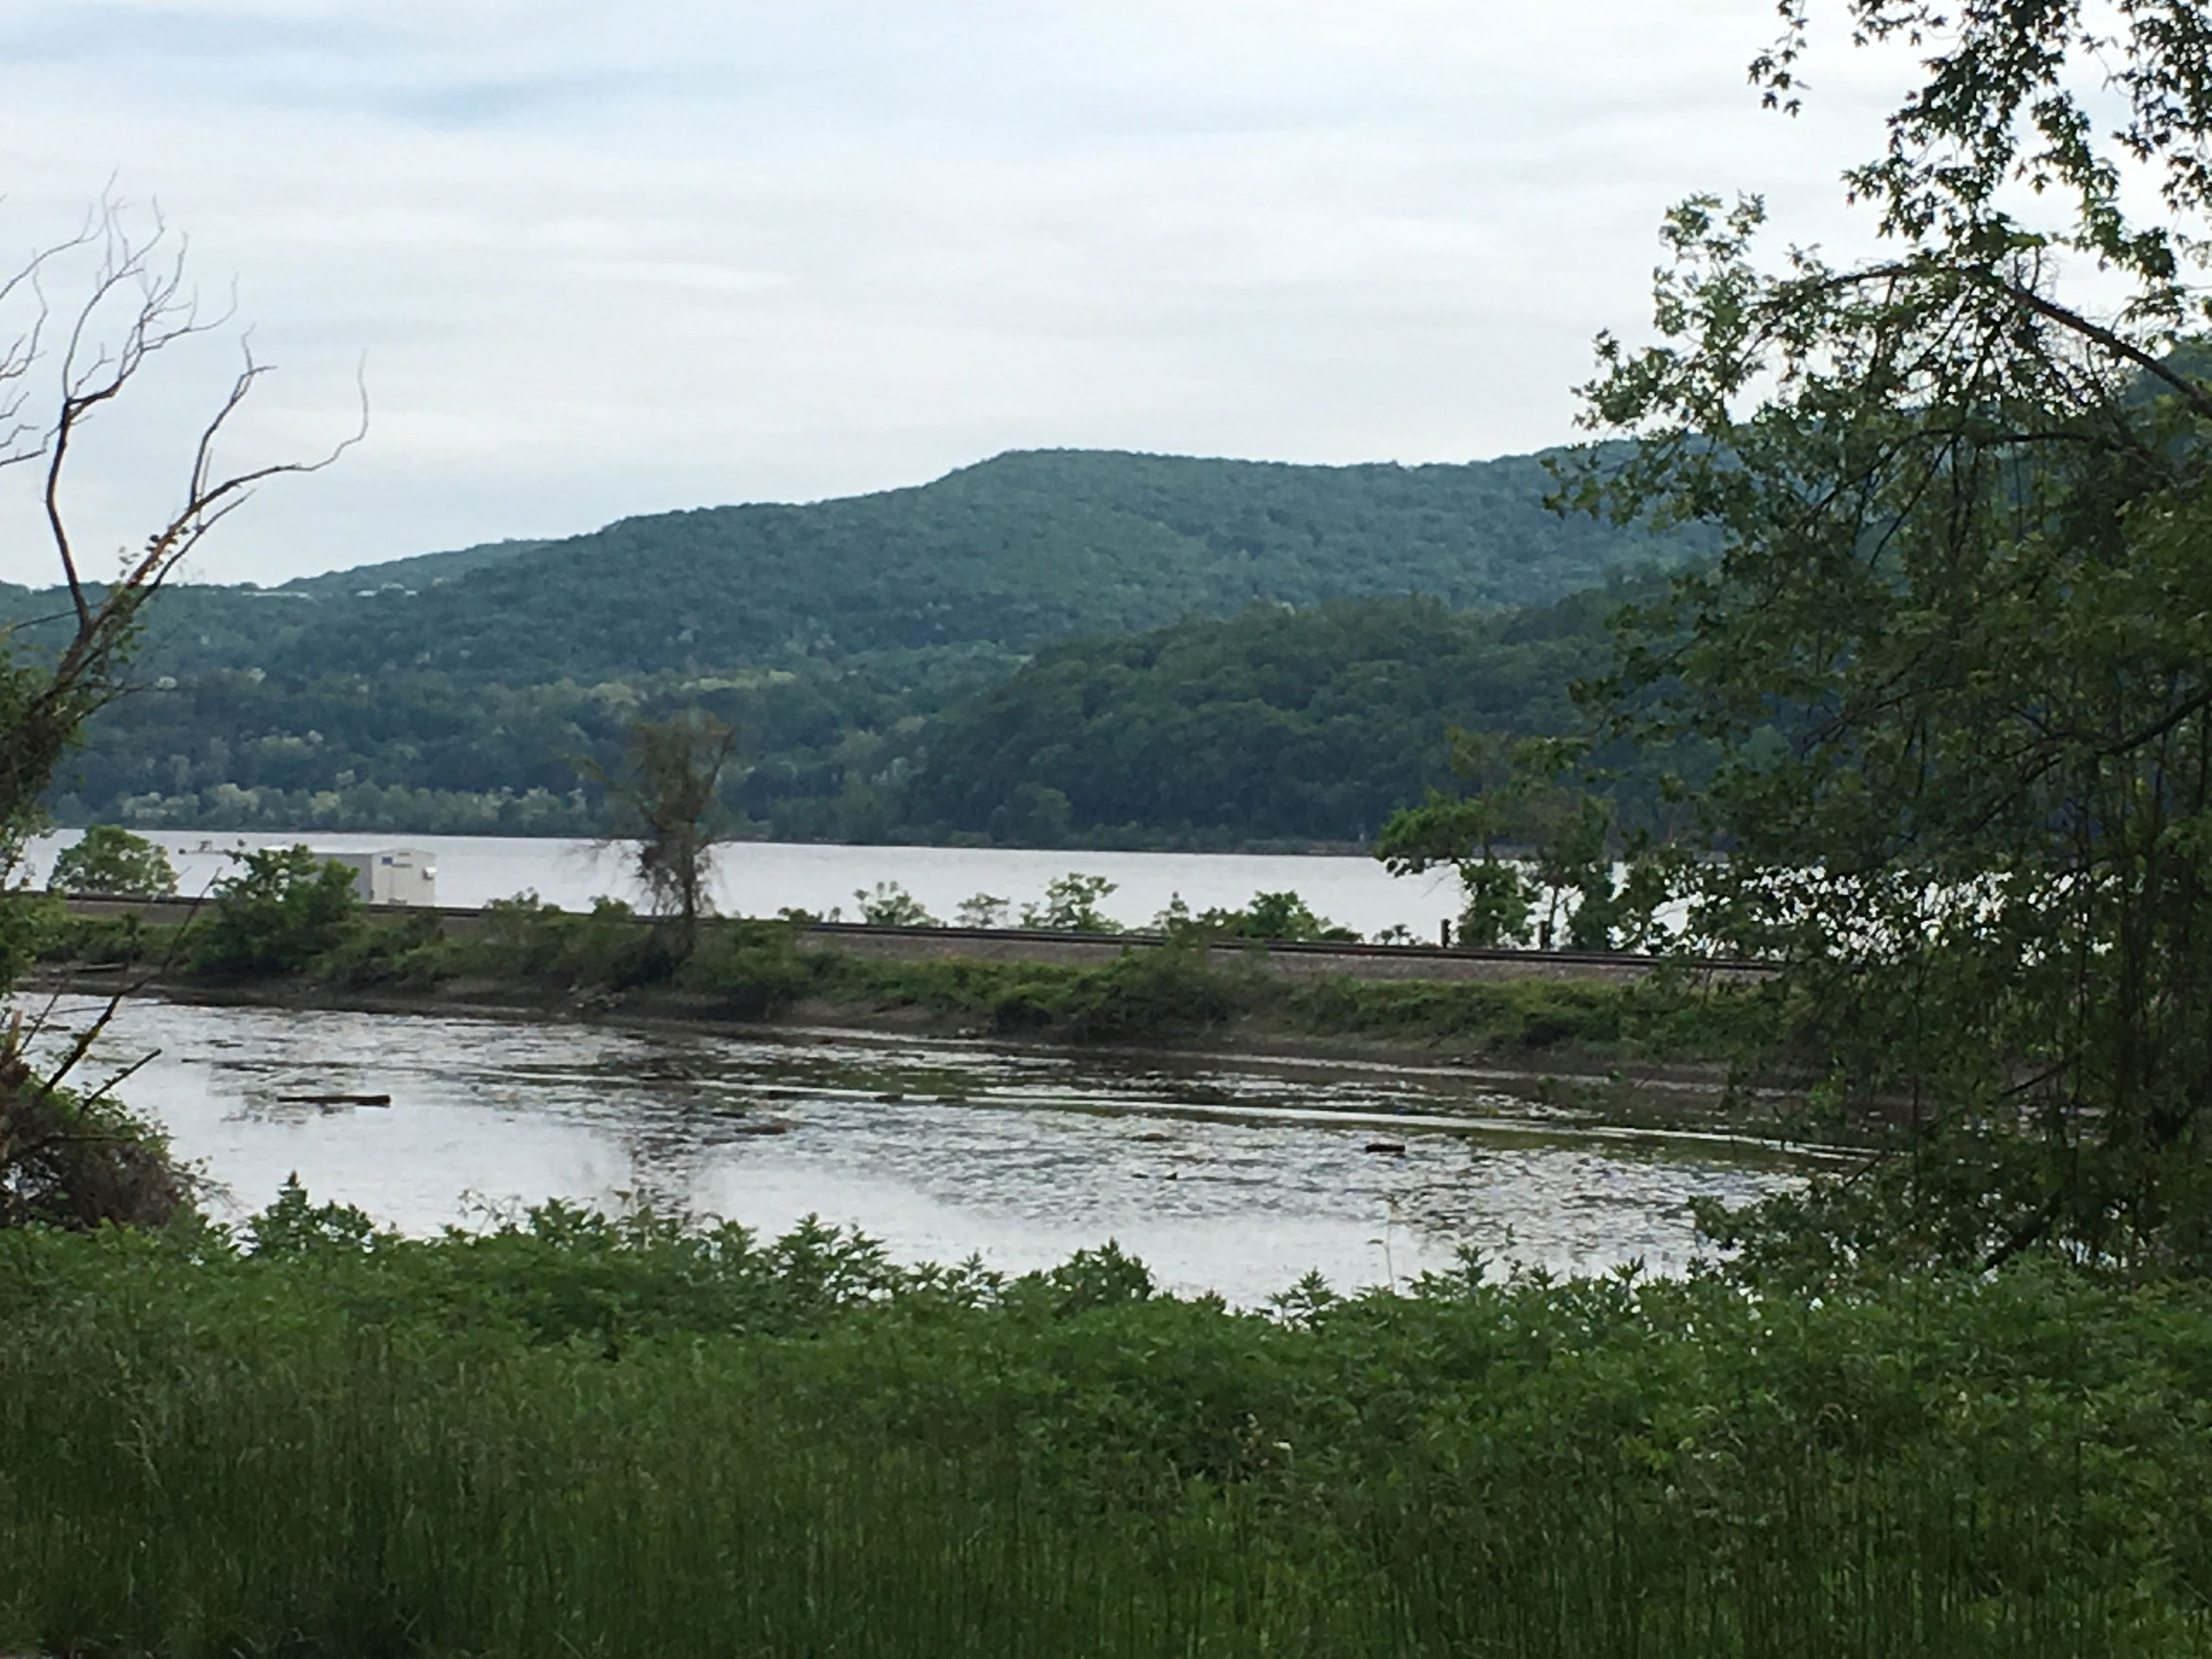
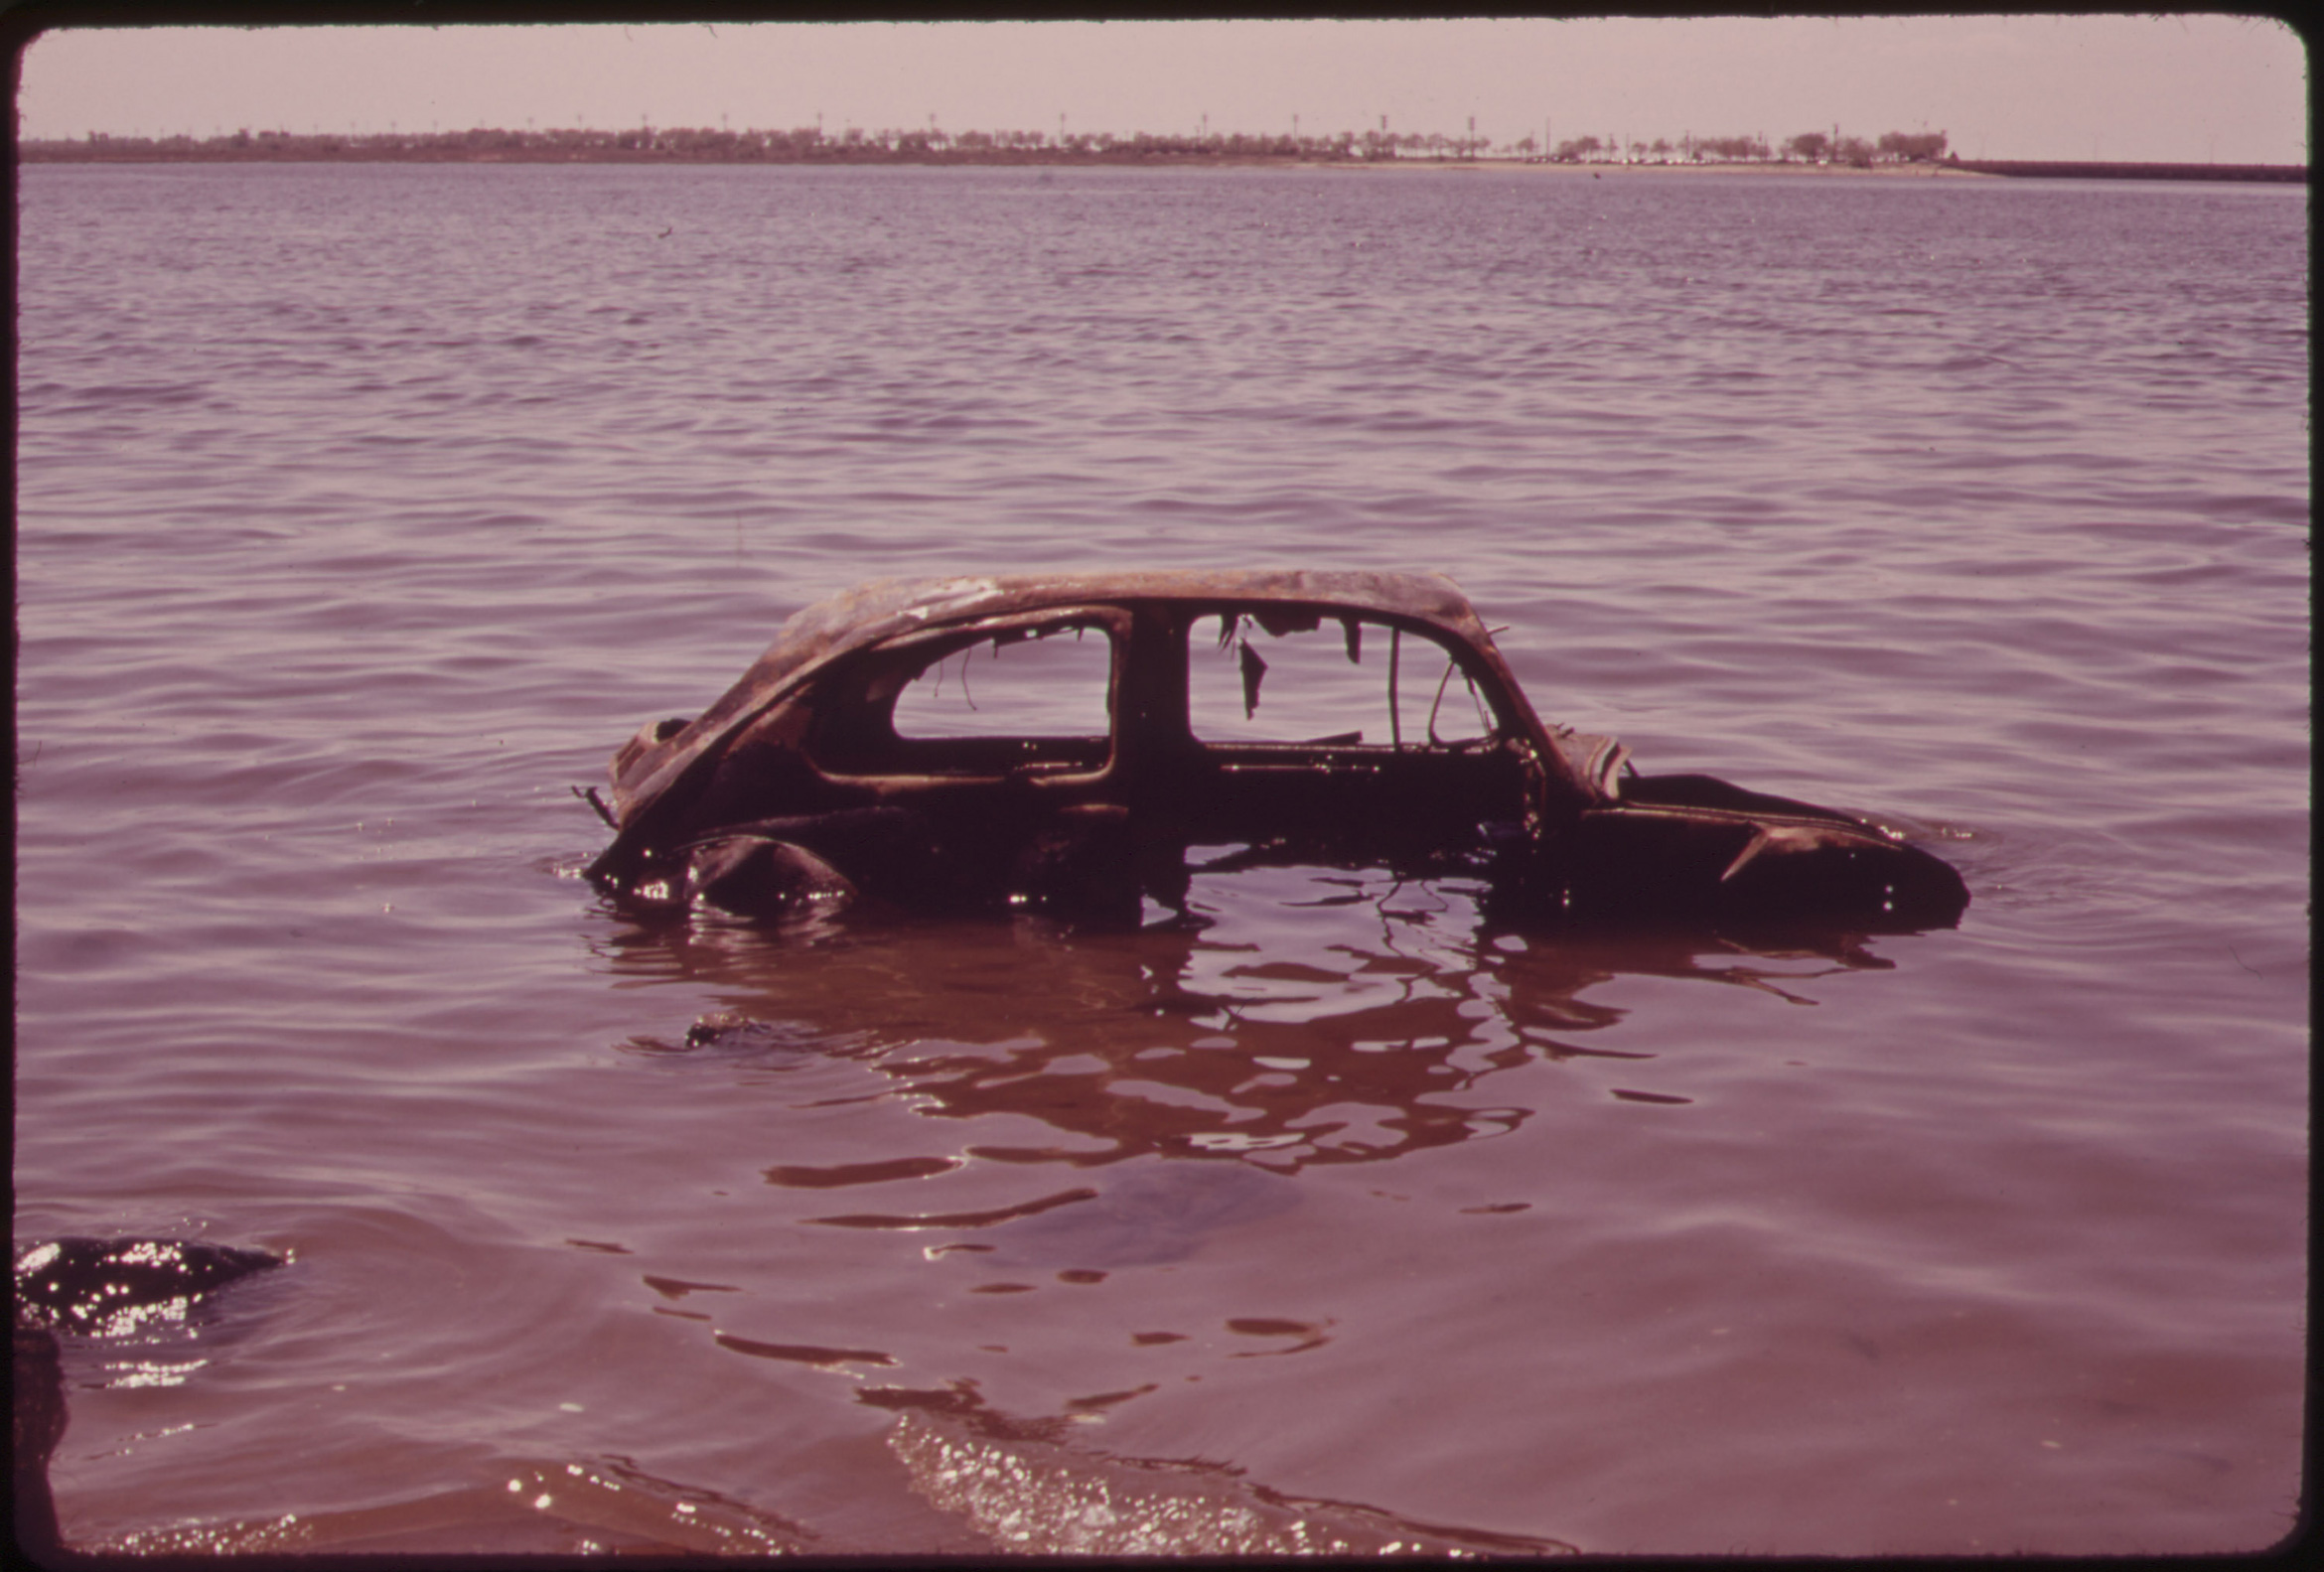
What we can see determines what we care about, understand, and take action around. From nineteenth-century scenic paintings to photographs of abandoned cars in New York Harbor, eyes on the Hudson River have built momentum for activism to protect the waterway and the complex ecologies it supports. This story drives the exhibition Hudson Rising, on view at the New-York Historical Society through August 4. A vital waterway that New Yorkers have depended on for shipping, food, building materials and recreation, the river has long faced environmental destruction, from industrial pollution to storm surges exacerbated by a changing climate.
Over the last two centuries, artists have painted, sketched and photographed the Hudson, while scientists, surveyors and others have mapped the river landscape as a first step to shaping it with human hands. Below, exhibition associate curator Jeanne Haffner explains how some of these historical images are finding new uses as activists, scientists, and designers look to the past to chart the river’s future.
At the center of this Hudson River School painting is a vegetated shoal, beyond which lies the northern entrance to the Hudson Highlands. Today, that same ridge is an Amtrak causeway, its edges hardened to accommodate speeding trains. The railway has been present since the 1850s: Was the artist attempting to paint an imagined landscape without the train, or to recapture a scene that he once saw with his own eyes?
This question has taken on new significance in the context of an ongoing project creating a hiking trail for the Hudson Highlands. The Fjord Trail, designed by SCAPE in collaboration with Scenic Hudson, the New York State Department of Conservation, and multiple other partners, will extend from Cold Spring to Beacon. Hudson River School paintings serve as the primary inspiration for bringing this iconic landscape to life: The designers are using these artworks to recapture the aesthetic experience of the paintings and their environmental ethos, as well as to envision a more ecologically varied shoreline. A report by John Jervis, the mid-nineteenth-century engineer who designed the railroad, indicates that the shoal in Pope’s painting was indeed present before the construction of the causeway. For the trail’s landscape architects, however, the question is not so much what “really” existed, but how such images serve a design approach that is at once aesthetic and ecological.
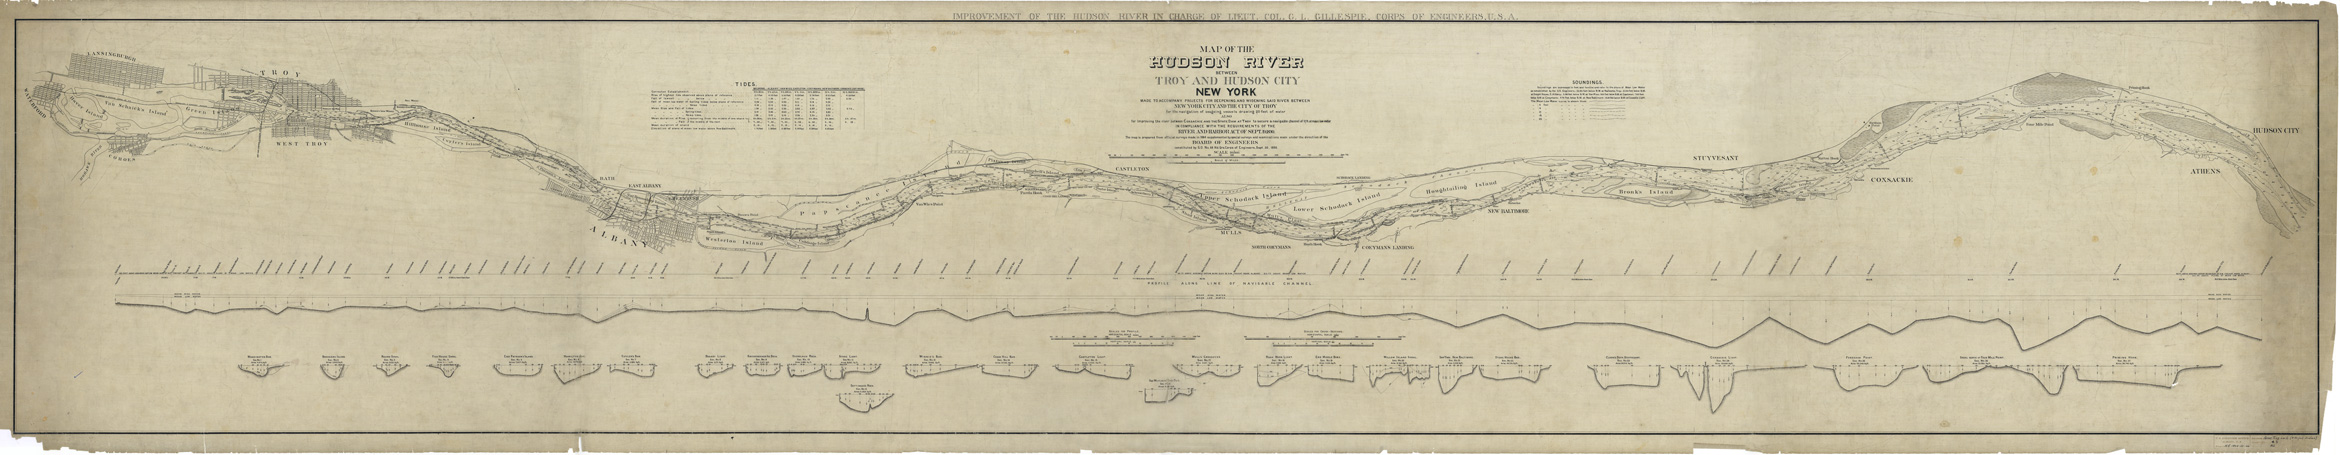
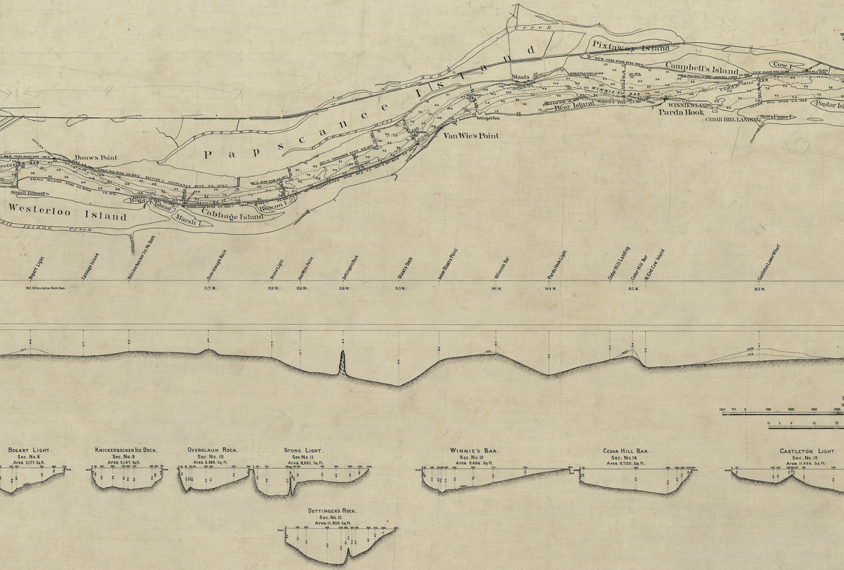
The Hudson River is as much an artifact of human intervention as it is a natural wonder. The Army Corps of Engineers created this “improvement chart” to document and guide their transformation of the upper Hudson in the late 1800s. Between Catskill and Troy, NY, the river was shallow and speckled with islands and shoals, making navigation difficult for ships traveling to and from the Erie Canal. Corps engineers constructed dikes on either side of the river to make the water flow faster and “self-scour,” or deepen on its own. When this wasn’t deep enough, they dredged the riverbed and moved the extracted sediment behind the dikes. The result was a new channel, much narrower, straighter, and deeper than before.
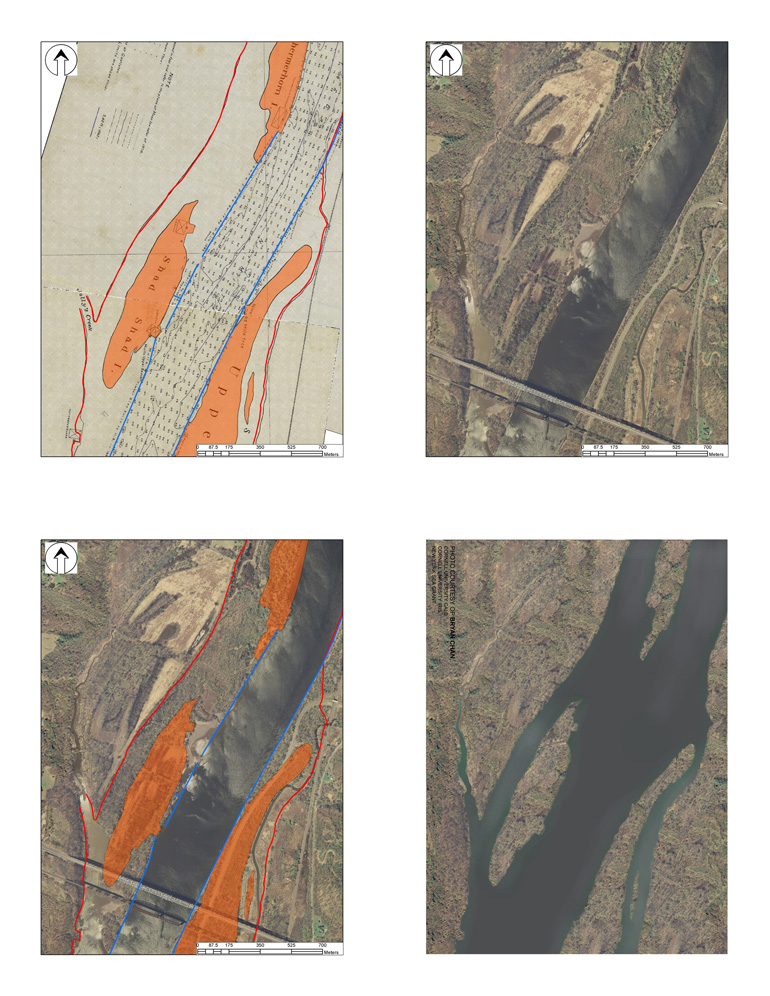
Dredging and diking made it easier for ships to carry grain, oysters, and other materials to and from the Erie Canal. But it also removed shallow water vegetation that filters water and provides critical habitat for fish, birds, and plants. Dan Miller, a restoration biologist/ecologist with the New York State Department of Environmental Conservation (NYSDEC), has used this same 1890 map, along with many other types of data, to try and reverse these negative effects. With his colleague, Bryan Chan, Miller overlaid the Army Corps chart with a contemporary satellite photo, and then subtracted portions of land to reveal what the original shoreline might have looked like. This digital recreation of the river’s edge in 1890 provides a sense of how the estuary functioned before diking and dredging, and where side channels, and the habitats they support, might be added or restored. In 2018, Miller and others at the NYSDEC carved one such passage at Gay’s Point, near Coxsackie, and are studying the results.
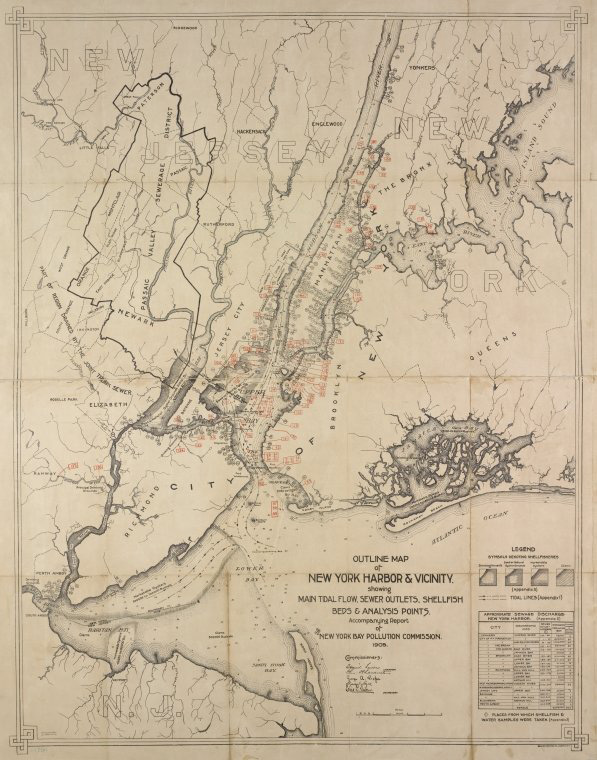
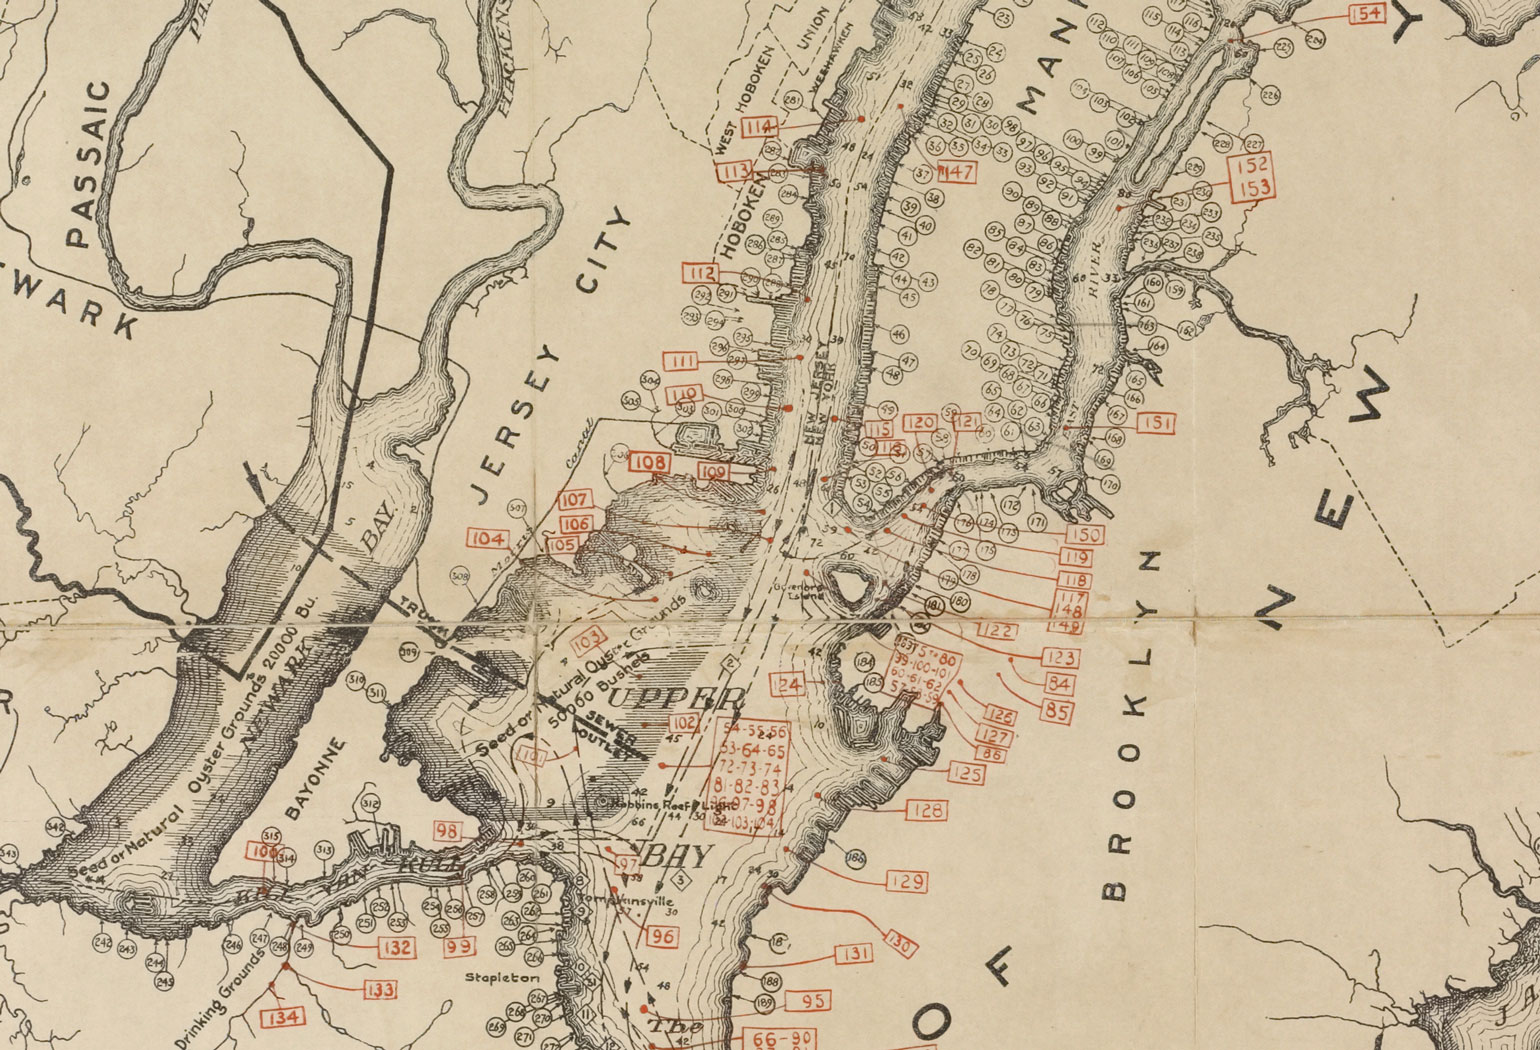
In the wake of a severe typhoid fever outbreak in New York City, the New York Bay Pollution Commission published the first systematic report on pollution in New York Harbor in 1906. Sanitation engineer George A. Soper marked the location of sewer outlets (in circles), oyster and clam beds (sketched on the map itself), and places where samples were taken (in black diamonds and red rectangles) on this map of New York Harbor. What Soper observed went counter to common assumptions: Sewage was not diluted by the tides; oysters that grew or were held in polluted waters absorbed high concentrations of colon bacillus, a bacteria found in human waste that was linked to typhoid. Soper’s map launched further investigations that ultimately ended oystering in New York Harbor. By the 1950s, as a result of pollution as well as dredging, overharvesting, and landfill, the harbor’s former 350 miles of oyster beds had largely disappeared.
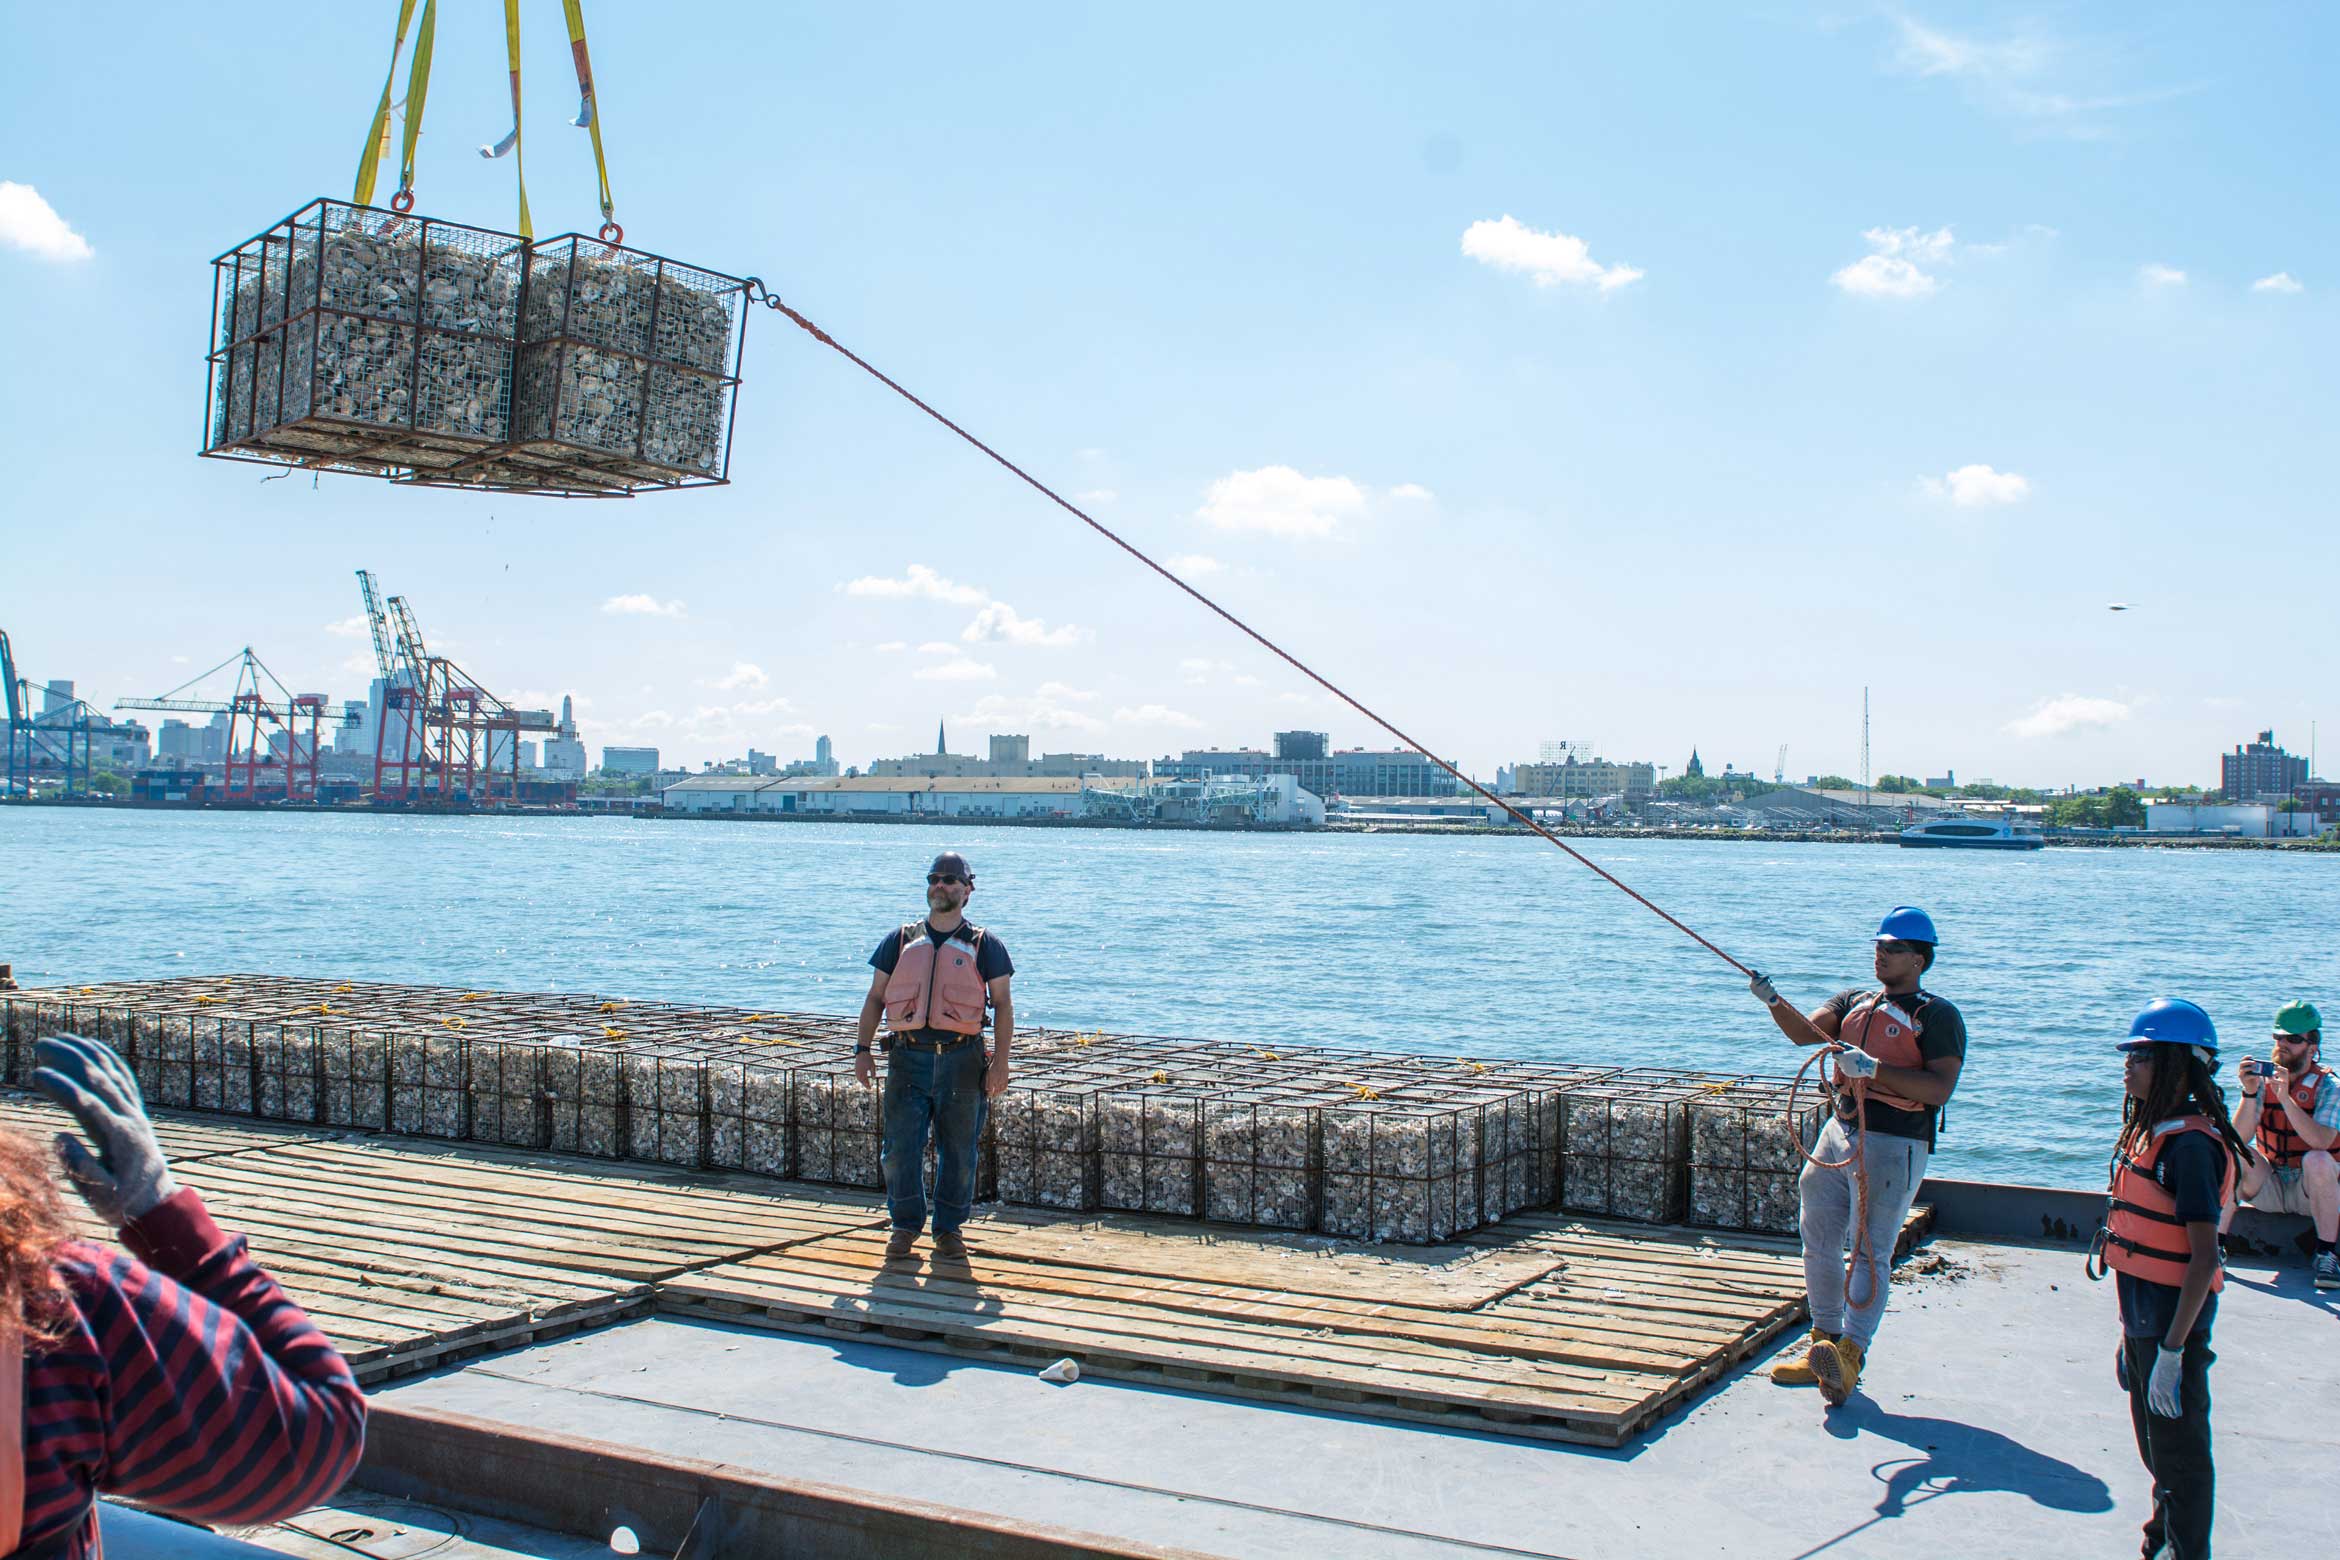
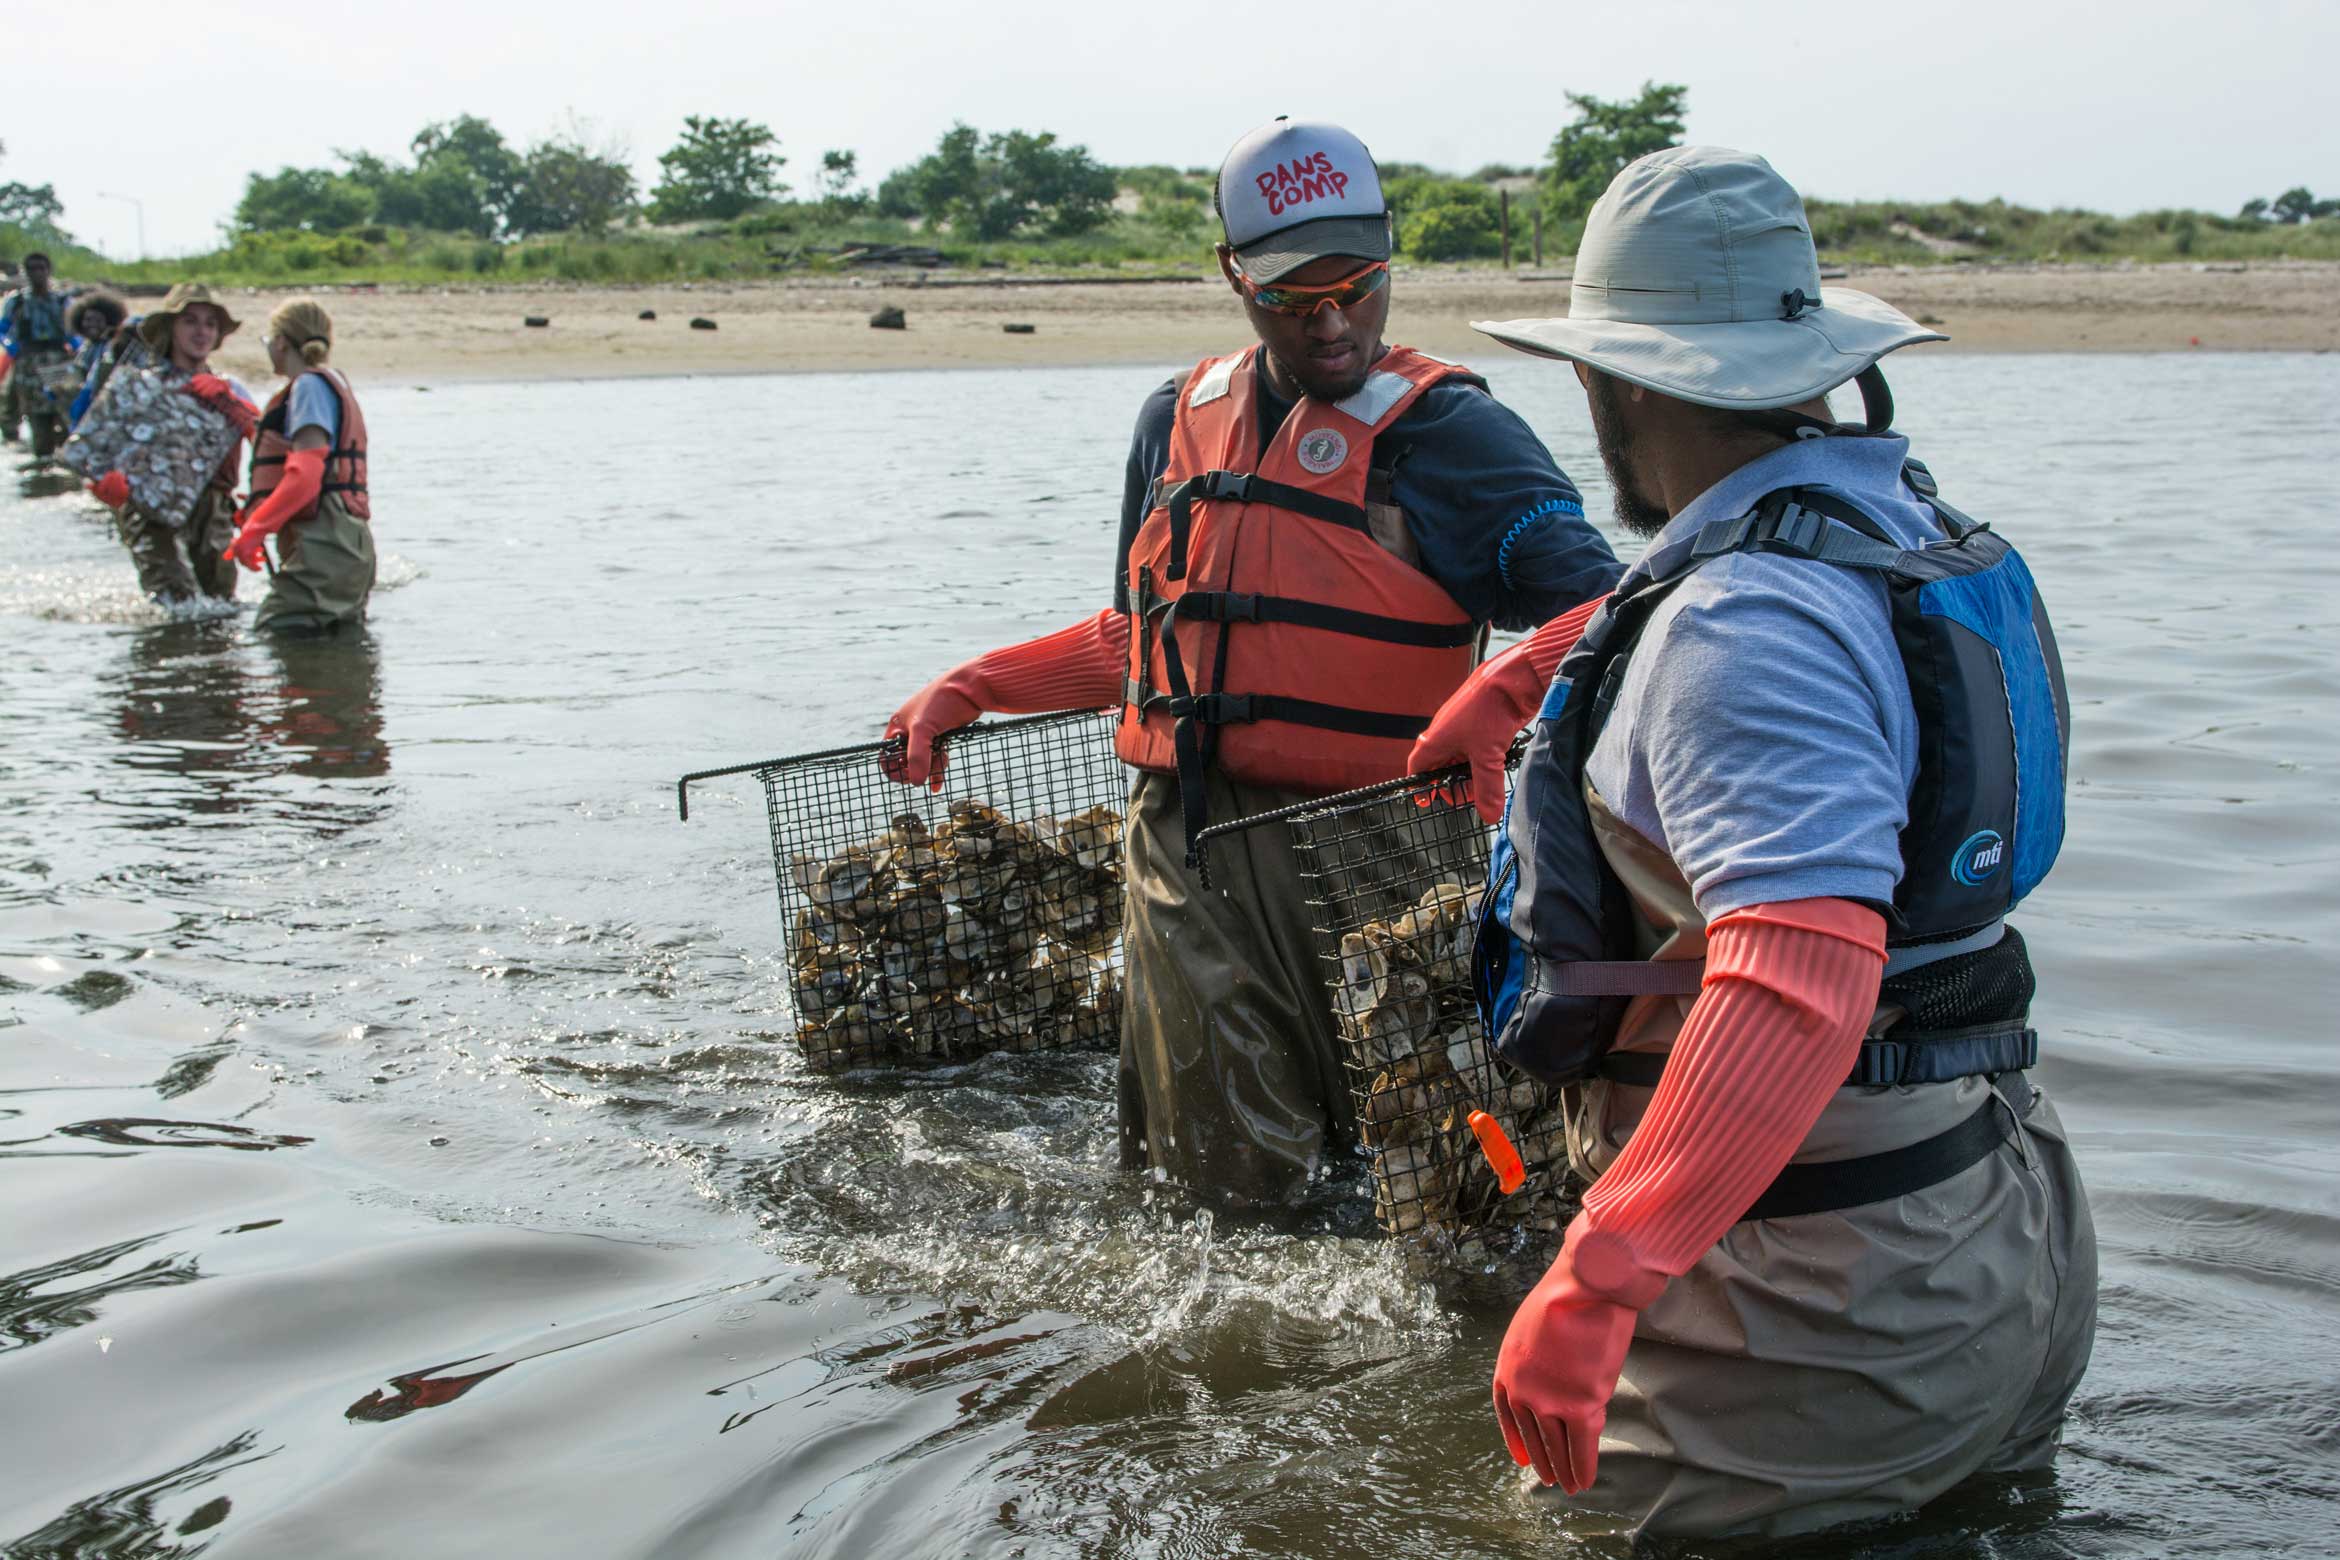
Today, designers, citizens, and environmental organizations are working to restore historic oyster beds in and around the harbor. It’s exactly their ability to consume waste that makes oysters so valuable: One oyster filters up to 50 gallons of water a day, and thus help to mitigate the effects of sewage disposal into the river during Combined Sewer Overflows (CSOs). Oyster reefs also provide habitat for many other species of fish, and reduce the velocity of waves before they hit shore. This is why the Billion Oyster Project aims to cultivate one billion live oysters in the harbor by 2035. They’re still too contaminated to serve as a food source, but these oysters are key indicators of the river’s health, and symbols of hope for its future.
In the early 1970s Arthur Tress and other photographers captured evidence of abandoned cars, tires, oil slicks, sewage, “sludge bubbles” and other visible wastes in the Hudson River and the Bay into which it flows. Tress and his contemporaries were on assignment for Documerica, a project by the Environmental Protection Agency (EPA) to document the impact of environmental degradation and show the need for governmental regulation. “The minute you take your eye off what’s happening, pollution rears its ugly head again,” remarked EPA Administrator William Ruckelshaus at the start of the program.
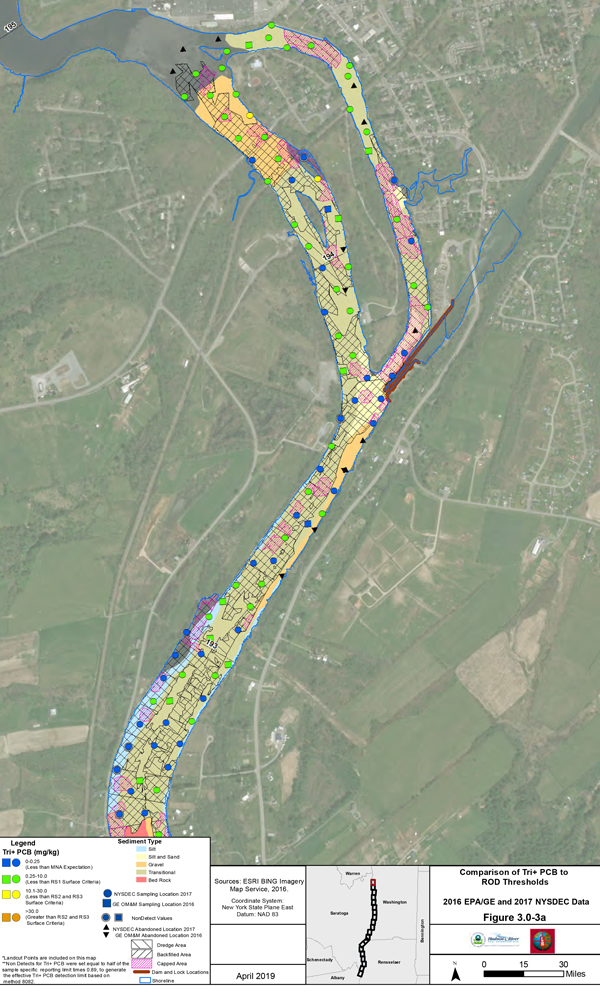
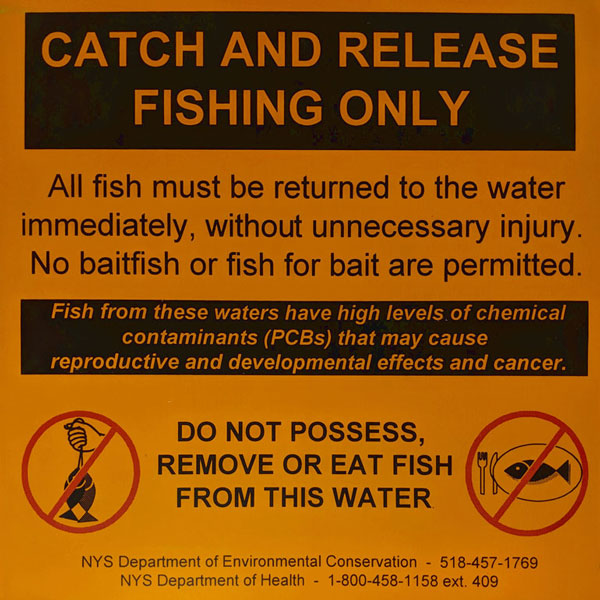
The health of the Hudson and other rivers improved immensely in the wake of the 1972 Clean Water Act and other legislation. But some contaminants are not as easily seen, sensed, or managed. PCBs are odorless compounds, and can only be seen in very high concentrations. As the Documerica project was underway, scientists first detected PCBs in Hudson River fish. Since the late 1940s, General Electric (GE) had discharged millions of tons of the deadly toxin from two plants into the Hudson. To clean up the damage, the EPA designated 200 miles of the river, from the battery to Hudson Falls, as a Superfund site. Working with the EPA and New York State Department of Conservation, GE dredged 40 “hotspots” from 2009 to 2015. The toxic material itself cannot be photographed; it is represented instead by charts and graphs. While such visualizations can help scientists recognize the existence of PCBs and their levels of concentration, they can never fully capture these unseen consequences of the river’s industrialization.
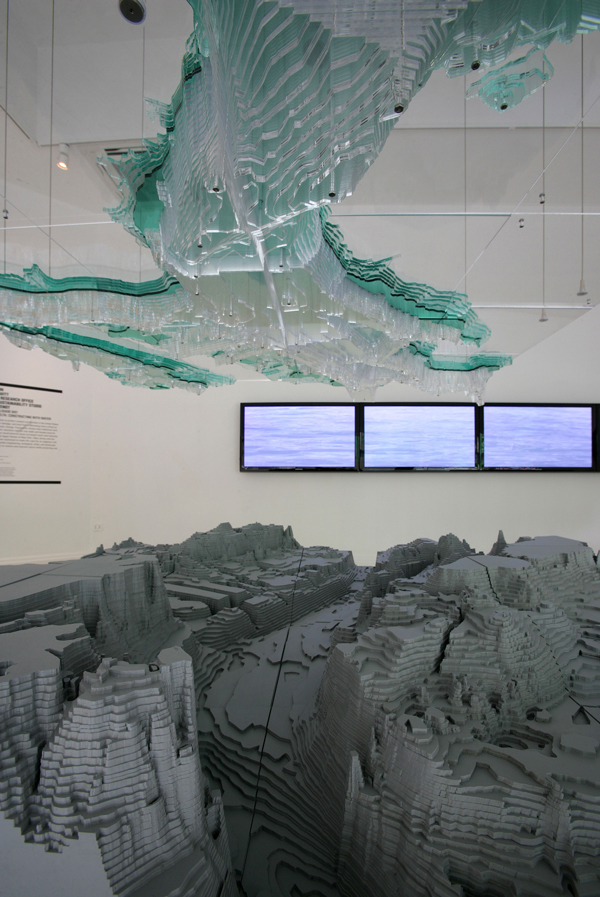
This large-scale model of the Upper Harbor of New York City depicts the continuity of land and water, merging the riverbed with the surrounding topography. The river does not end where the water ends: Housing and other development along much of the New York and New Jersey waterfront rests not on solid ground, but on the backs of ancient flood plains. The model extracts the volume of water in the harbor and suspends it overhead to reveal the contours of the riverbed and surrounding topography. The dark-green layer portrays the extent of two feet of sea-level rise, while the light-green layers represent flooding from a storm event.
Based on scientific data, the model was built as part of a design project, On the Water: Palisade Bay (Guy Nordenson, Catherine Seavitt, and Adam Yarinsky, 2007), to inspire new alternatives to sea walls and storm surge barriers to protect the shoreline. In the wake of Hurricane Sandy, New York City and State have lent support for softer infrastructure to mitigate flooding and help the city adapt to rising waters. Landscape architects from SCAPE created this visualization to educate the public about Living Breakwaters, a coastal infrastructure project developed as part of the Rebuild by Design competition after Hurricane Sandy. A series of breakwaters will not only reduce the intensity and height of waves before they hit shore, but also restore biodiversity, inspire people to visit and care for the beach and harbor, and strengthen the social ties that can make shoreline communities more resilient to storms. Here, creatures of the harbor are presented as residents of the bay and stakeholders in the planning process alongside humans.
Almost 200 years ago, artists of the Hudson River School used painting to get a 19th-century public to care about an environment that was vital to human civilization yet threatened by humans’ accelerating exploitation of natural resources. Instead of oil painting, 21st-century designers have turned to novel technologies—especially digital ones—to generate new ways of seeing, understanding, and ultimately shaping the Hudson for a more resilient future.
The views expressed here are those of the authors only and do not reflect the position of The Architectural League of New York.