
We are celebrating 15 years — and counting — of stories that are deeply researched and deeply felt, that build a historical record of what the city has been.
We are celebrating 15 years — and counting — of stories that are deeply researched and deeply felt, that build a historical record of what the city has been.
The statistic is everywhere — now, for the first time, more than half of the world’s population is living in cities. At the same time, technological advancements in information gathering provide ever-expanding opportunities to examine and assess the way we live. Making sense of this bounty of information, however, and learning how to find meaning from the data are daunting challenges.
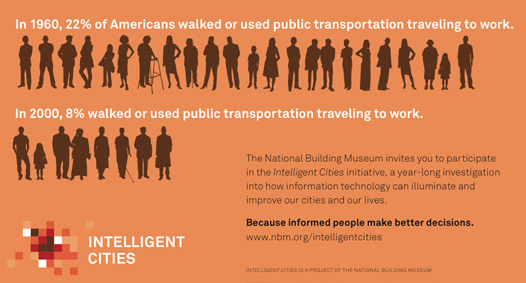
The Intelligent Cities Initiative, a project of the National Building Museum, is an effort to investigate the intersection of information technology and urban life and design. In partnership with TIME and IBM, and with funding by the Rockefeller Foundation, the Museum has launched a multi-pronged effort to understand how we live in cities today, the choices we’ve made in the past, where we want to be in the future and how we can make better-informed decisions to reach those goals. And they want input from as many people as possible — that means you — to help them do so.
Intelligent Cities launched in November 2010 with the first of a series of polling questions centered around six scale-based topics: the home, the neighborhood, the community, the city, the region and the country. While gathering answers from the public, the Museum is also developing a series of explanatory infographics and preparing for an upcoming day-long forum, a publication and an Intelligent Cities exhibition to be held in 2013.
Here, Susan Piedmont-Palladino, the curator of the Intelligent Cities project, and Scott Kratz, Vice President for Education at the National Building Museum, tell us more about the initiative, how they have turned a typical curatorial process on its head, and what they’re doing to help people understand the broader implications of their individual choices and make better decisions through better information. –V.S.
What is the Intelligent Cities Initiative?
Imagine the cloud of information that hovers over all of our cities, containing all the chatter, the communication, the patterns, the history and the data being collected and yet to be collected. Intelligent Cities is looking at how we can harness all of that information and put it in a form that people across disciplines and professions and the general public can use to make better decisions about making better cities. We want to make this stuff visual. We want to make these things present. The project is a comprehensive look at the world of information and the designed, planned, physical world of cities – the built environment, the natural environment, human behavior, a whole host of things.
There are two phases to the Intelligent Cities project. In phase one, we are publishing infographics and ads in TIME magazine that drive people to the website, where we are posting polling questions for the public to respond to. In June, we will host a one-day forum in DC and then we will finish up phase one with a publication. Phase two, which is the culmination of the whole initiative, will be an exhibition held at the National Building Museum in 2013.
There is an enormous amount of information out there. But that’s the problem – it’s out there. It’s not visible and, much more importantly, it’s not useful.
In a typical curatorial process, I would be engaged in some pretty intense but also reclusive research. Gradually, that would turn into an exhibition, a catalog and a series of public programs and outreach. The Intelligent Cities initiative turns that process upside down.
The forum in June will be both a physical and a virtual gathering of people involved in design, planning, policy, resource conservation, cultural resource conservation, gaming, civic participation and more. The book will focus on conclusions and questions that emerge from the earlier parts of phase one and will also serve as a guide for developing the exhibition. But again, though the exhibition will definitely be a physical display, we hope it will have all sorts of virtual tentacles to reach out to places yet to be determined.
Tell me more about the process. How does it work?
The first step is digital outreach, getting people to contribute content to the Intelligent Cities website. There, users can answer questions about decisions they have made about their own homes, their neighborhoods — their individual choices. We have ads in six issues of Time Magazine, centered around a set of infographics we are developing, that are another way to provoke curiosity and interest and drive people to the website to contribute their feedback.
So far we have launched three topics — the Home, the Neighborhood and the Community — and are currently developing three more: the City, the Region and the Country.
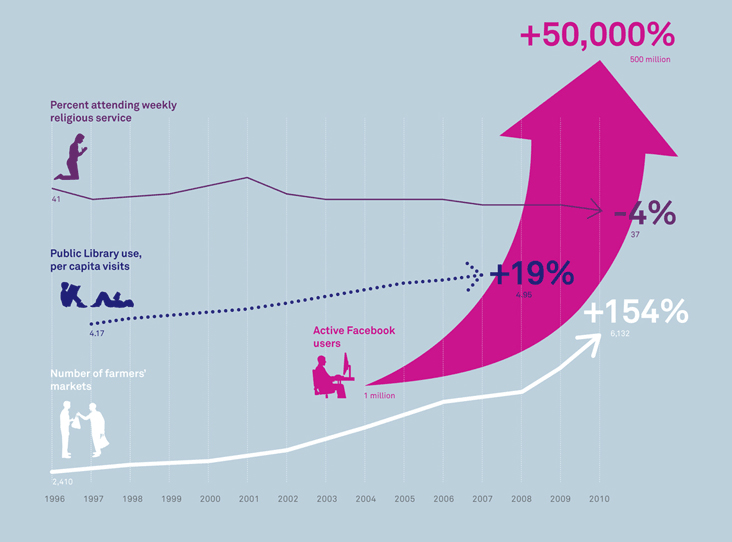
Searching for the data for the infographics has been fascinating. You might expect information about trends in these categories to be easily accessible – just do a Google search and you’ll figure it out. But it’s not. For instance, I have been researching the growth of big box stores in the US. Finding clear, accurate information about those trends has been incredibly difficult. I’ve had to read several PhD theses, reports by the Census Bureau, and data sets loaded with caveats. But every dead end that I hit underlines the value of the project. There is an enormous amount of information out there. But that’s the problem – it’s out there. It’s not visible and, much more importantly, it’s not useful. It’s not useful to the professionals who work in the built environment and its not useful to the general public.
What kinds of information are you asking about?
We are setting this up according to scale, in a sort of expanding set of concentric circles. We start with the home and move out to the neighborhood, then to the community, the city, the region and the nation. Because all of the decisions we make about our homes, those decisions which seemed so personal, have ramifications at the next scale up and the scale after that, all the way up to the largest level.
We all need to start making better decisions — and that starts with clear, actionable information that more people can understand.
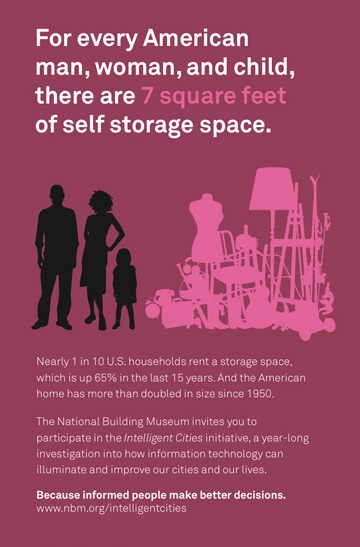
For example, in the Home infographic, we take a piece of information that many of us are aware of – the size of the American house has gotten larger while the size of the American family has gotten smaller – and treat it as more than just a quirky piece of trivia. That trend has huge implications for density, land use, transportation and energy use. We want people to think about what the consequences are of the decisions we are making. So we started exploring the topic by asking people what considerations they took when deciding where to live.
We’ve been surprised by the polling results to date on the questions about what motivates people to live where.
You might think that everybody makes decisions on where to live based on money. But, by a wide margin, the top answer to ‘Why did you choose where to live?’ is ‘Because I can walk and bike to stuff I like.’ These questions are a little more nuanced than a lot of conventional wisdom might lead you to think. Of course, this is not a scientific sample, but still.
How do you determine the questions?
I think of it as a design process, really. There’s a lot of tinkering, tossing out ideas, running word choice past our colleagues and advisors, until we eventually come to a consensus. We want the questions to be quite brief – we don’t want people to feel like they are taking a test or that there is one “right answer.”
We work a lot on the tone. I guess we could call it the Intelligent Cities Voice. The Intelligent Cities Voice is conversational and we use the second person regularly, which is very unconventional in academic writing. But we found that both the web and the character of the Intelligent Cities project lend themselves to that kind of voice.
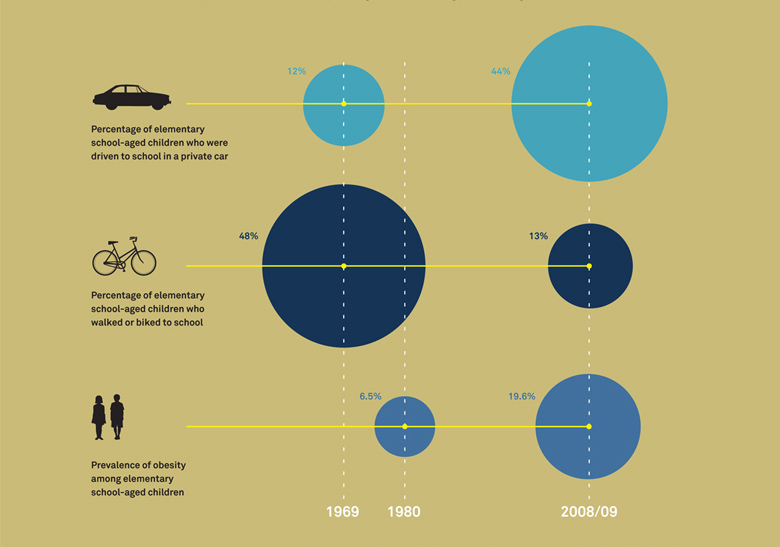
We pose the questions from three angles. One asks people about their perception of the built environment. The second looks at what barriers to change exist. For example, the Neighborhood poll asks, Do you allow your children to bike or walk to school? If you don’t, why not? Are you are concerned about safety? That your kid might be kidnapped? Are there no bike lanes? Do you physically live too far from schools to bike or walk to your school? Thirdly, we want the general public to more actively consider those kinds of connections, to break down some of the silos of their thinking about the built environment.
The last question asked during phase one will be a crowdsourced question, voted up by our delegates. We’re really intrigued to see what that turns out to be.
Tell us more about the delegates and what groups you are engaging outside of the public outreach effort.
We want to engage individuals on a number of different levels. We have gathered a Board of Advisors from the public and private sectors, design, planning and academia. And then we are collecting about 150-200 folks we’re calling “delegates.” The delegates aren’t necessarily people in positions of power or expertise. They are the next generation of tech-savvy design professionals, civic activists, young faculty, recent grads — people who just have a lot to offer, want to be involved and also are extremely savvy in the social media world. And we want them to communicate with us, form their own discussion groups, share ideas with us. I’m really looking forward to mining that wonderful group of people during the research phase for the exhibition.
So you are going to work to represent the results that you get from this series of questions and forums and then communicate that outwards again?
During each stage of the project, one month after another, we reflect on what we’ve learned, which generates more conversations, mini-forums, chats – more questions. We want the project to build on itself.
The polling question segment of the project will end in March, at which point we will lock ourselves in a room to reflect, digest and prepare for the June forum. We don’t want the forum to be the usual three panelists and a moderator, coffee break, three panelists and a moderator. And we use the term “forum” on purpose, as opposed to conference, symposium or convention, because the forum is a place of discussion. It’s a political space, an urban space, a physical space, a virtual space, a space where there are people who are invited, but where there is also room for people to step up and volunteer to take a seat and to converse.
We will also be fleshing out the structure of the publication. What works on a screen doesn’t always work in print. And once the forum ends in June, we will gather up those findings and feather them into the book as well. All the while, of course, I’m keeping a running outline of possible ways to structure the exhibition. That will remain extremely fluid for a while.
That was my next question. How do you turn all this into a presentation that one encounters in physical space?
It’s a little premature to talk about it, but we have some ideas. The primary mission of the Building Museum is to educate the public about the built environment and one of the things that we can do in an exhibition that isn’t so easy to do on the website, and that we may not have room to do in the book, is to give context to this entire discussion. How do we know the city? How do we see ourselves throughout history? Citizens, artists, urban planners, and philosophers and writers have been engaged in this same task for generations, using whatever technologies were at hand. What can we learn from them?
So we’re envisioning something that is dynamic, immersive and interactive. Bits of the exhibition might be in other locations. It’s going to be an interesting challenge for whoever gets to be our exhibition designers. The Building Museum has a long track record of taking on subject matter that might, on the surface, have seemed, how should I put this…
Daunting, maybe?
Unlikely to make a good exhibition, you might say. We had a whole exhibition on air conditioning years ago that was just spectacular.
What are your ultimate goals? Why is the National Building Museum doing this?
The Building Museum wants to remind us all that buildings, landscapes and cities are crucially important. Place still matters, even if we are all connected digitally – in fact, it matters more. We are adding this other layer of communication and representation to the built environment and we need to start to reveal to ourselves the new conditions, problems, beauty or other potential scenarios that come with that.
To achieve that goal, we are asking people to think about choices they have made and understand the choices made by others. What we get to do is add some reflection and contextualization.
For those of us in the professional world, it’s part of our ethical responsibility to learn how to communicate more broadly. And so with the infographics, with the polling, with the narratives, and eventually through the forum, the book and the exhibition, we are trying to get this project to as large an audience as we can. We want to talk to a multi-layered audience that includes the general public, but that also includes elected officials.
The important thing is seeing the connections between these data sets, not necessarily seeing the individual pieces of data. There are connections between the size of the American home and the energy we use. There are connections between kids being driven to school instead of biking or walking and obesity. These elements inform each other. We want a larger audience to understand the community implications of individual choices.
Our agenda is a more sustainable world. And our contention is that we all need to start making better decisions — and that starts, not necessarily with more information, but with clear, actionable information that more people can understand.
This is an issue of democracy. We want to broaden the conversation and help the larger populace really understand the issues in front of them and realize that they can make meaningful contributions to the decisions about the future of their cities, their towns and their neighborhoods.
The views expressed here are those of the authors only and do not reflect the position of The Architectural League of New York.


Comments