
We are celebrating 15 years — and counting — of stories that are deeply researched and deeply felt, that build a historical record of what the city has been.
We are celebrating 15 years — and counting — of stories that are deeply researched and deeply felt, that build a historical record of what the city has been.
A change is underfoot. More gas than ever flows through networks of pipes beneath New York City’s streets, destined not only to turn on the city’s lights and fire up its frying pans, but also to power mini turbines. This unprecedented reliance on gas for both supply side electricity generation and for direct use is buoyed by low prices (thanks to controversial extraction practices such as hydraulic fracking) and deliberate measures to phase out coal and heating oil. But just how is all this gas getting from source to stove top? In this first installment of a three-part series, landscape architect Nick Pevzner explores what the language of spray-painted street markings reveals about the infrastructure below. From old metal to modern plastic, the materiality of these conduits speaks to a long and complex history. It also points to pressing questions around today’s energy mix. How might updating the city’s subterranean network increase public safety, given the potentially explosive nature of the aging infrastructure? And what impact will pipe replacement have on the more insidious danger posed by methane leaks? Does upgrading the underground gas delivery system offer one of New York’s best chances to reduce its carbon emissions, or lock the city into an unsustainable dependency for decades to come?
Beneath New York’s streets runs a tangle of pipes and wires that carry the infrastructures of the city — a humming, steaming, hissing tracery conveying all of our utilities and services. For most people, these buried systems are out of sight, and consequently out of mind. As long as the electricity and internet keep flowing, and the water and sewer service runs as intended, most people rarely give a thought to these crucial networks.
Occasionally these buried systems break through to the surface, compelling our attention. Usually this happens when something goes awry in large or small ways — steam billowing from the pavement through a warren of minute cracks, or water mains suddenly flooding intersections as a result of a major rupture — but for the most part they operate continually in the background. The smooth asphalt obscures the extent to which the space below our city streets is occupied by these overlapping, intersecting infrastructures. But certain street markings offer clues to the city’s true complexity, if you can read the language.
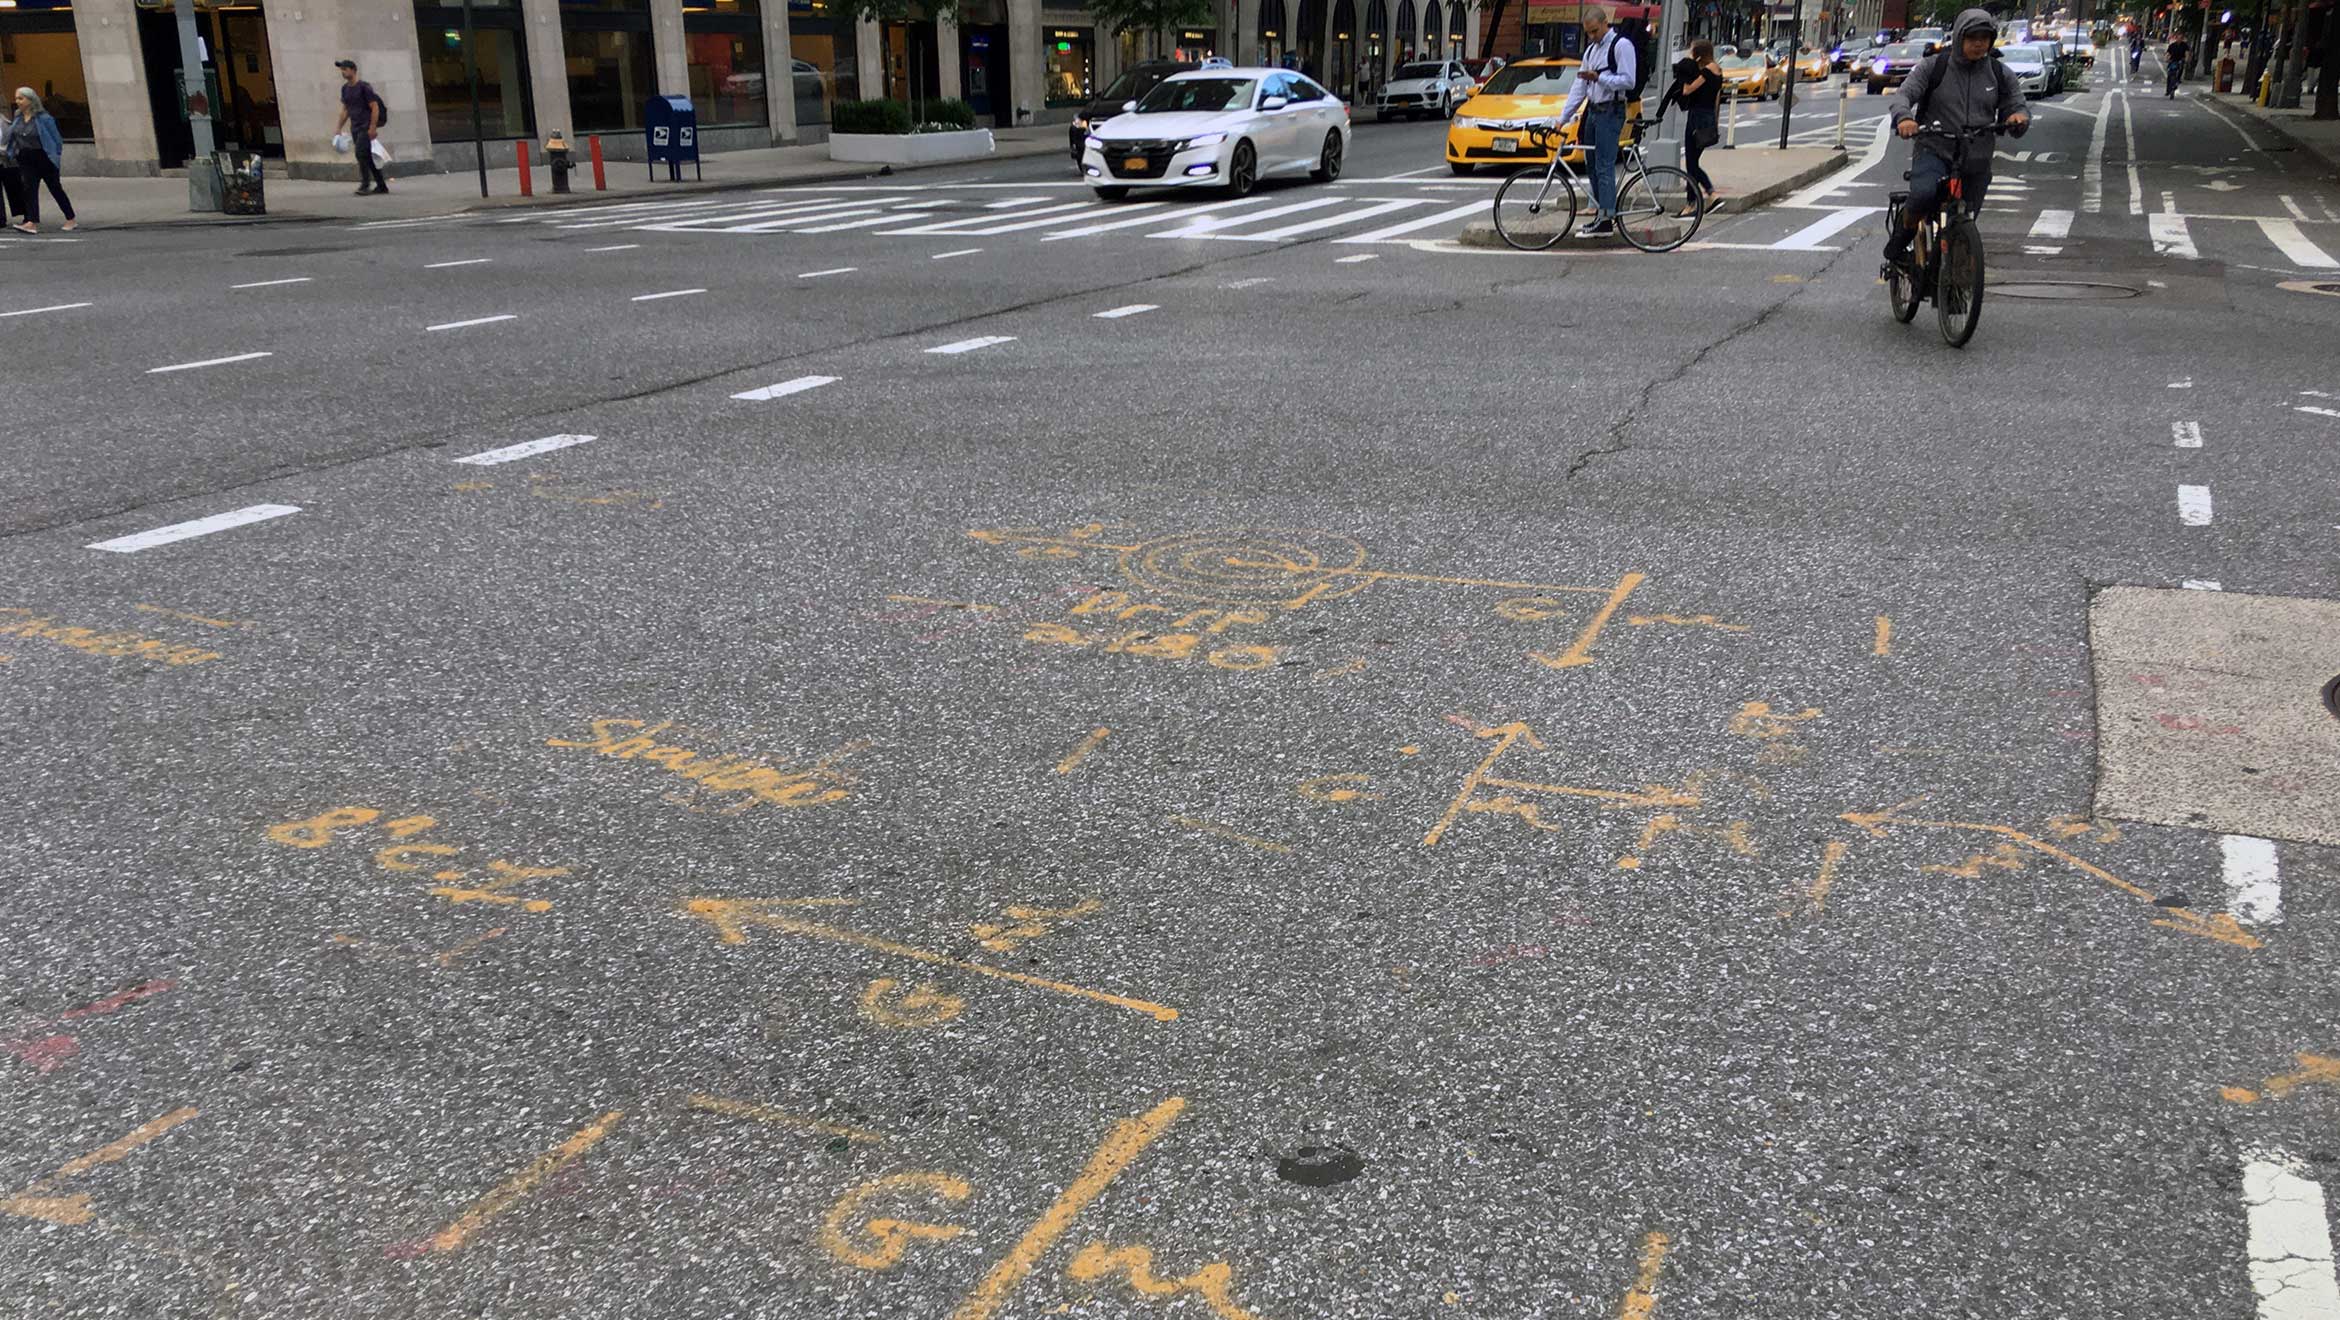
Throughout the city, one encounters multicolor annotations on the street, some scrawled quickly, others spelled out carefully. These cryptic spray-painted messages tell the story of what transpires underfoot.
Yellow markings denote the distribution lines for natural gas. Some are pipelines bringing gas into the city, some are large-diameter transfer mains moving gas between its storage sites, some are distribution mains moving it along the streets and avenues, and some are service lines entering the thousands of individual buildings. They supply natural gas to residential stoves, boilers, and heaters; and to industrial customers for heavy-duty thermal work, as well as, increasingly, to turn electricity-producing turbines in high-rise buildings and in power plants.
Where did all these marks come from, and why are they there? They are called utility markouts, and their origin stems from a 1976 excavation accident in Culver City, CA when a crew excavating a median on Venice Boulevard hit a high-pressure oil pipeline, causing an explosion that killed nine people and took out an entire block. Following this accident, the Dial 8-1-1, DigAlert, DigSafe, and Dig Safely NY systems were born, which has led to the practice of the companies that own the infrastructure marking out utility lines in countless cities following a standardized set of symbols and colors.
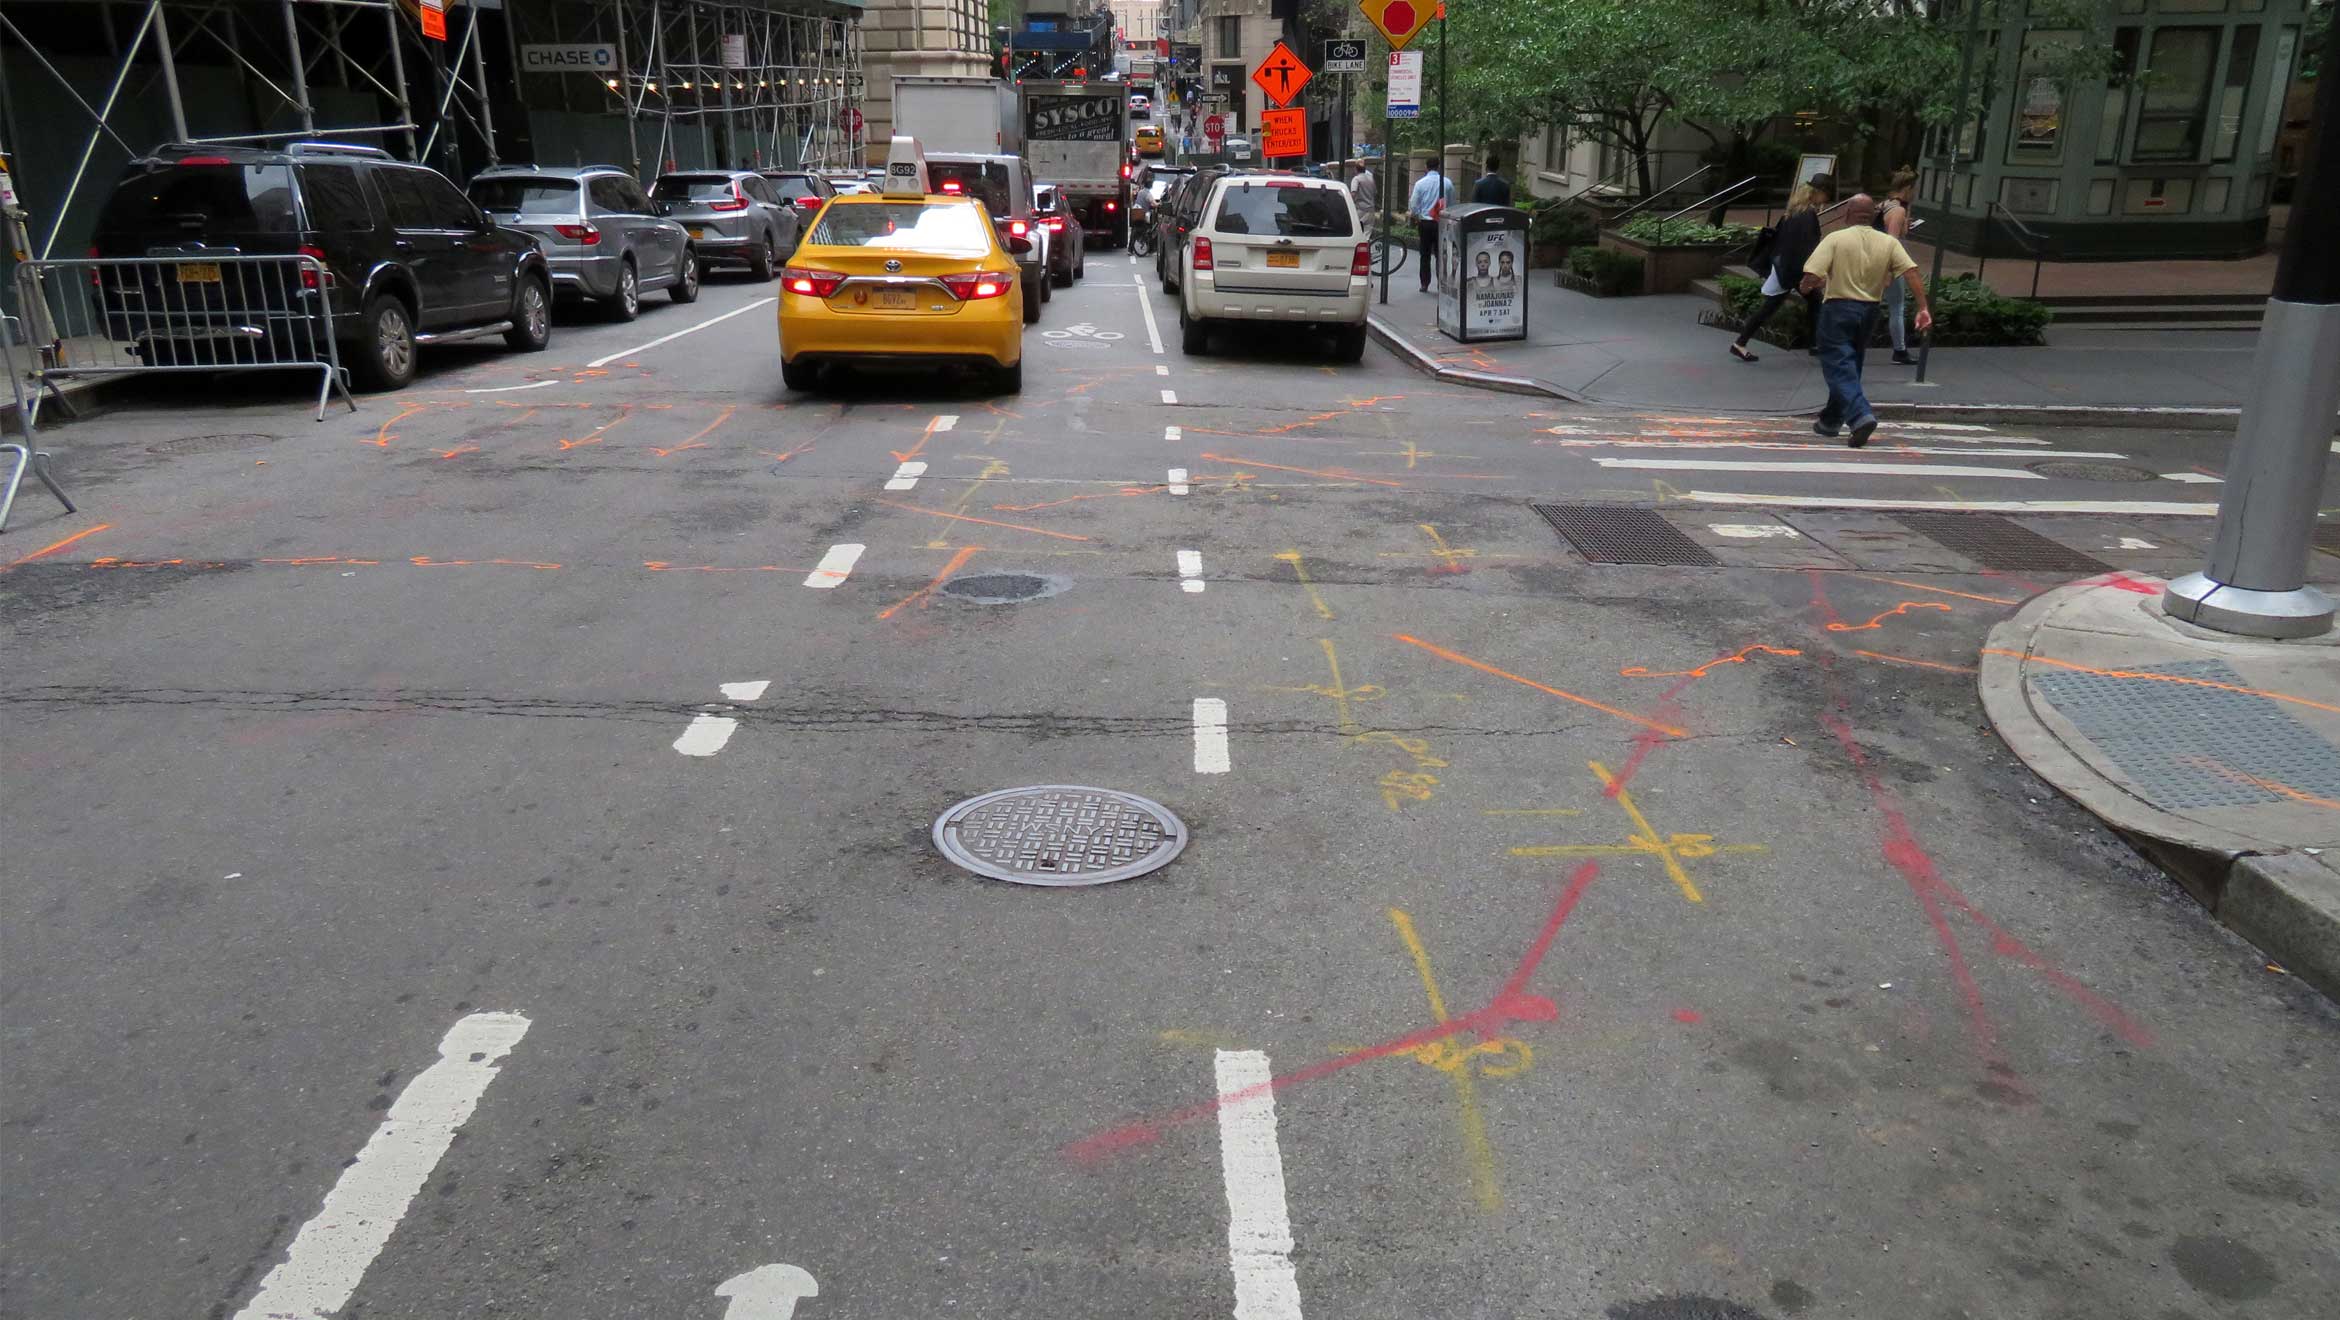
Red painted lines emerge from Con Edison electrical manholes and make their way toward streetlights, duct banks, and buildings.
Orange lines connect cable trunk cabinets to cable pull boxes and wifi access points (Ingrid Burrington has catalogued these orange marks, which signify underground telecommunications infrastructure such as cable TV cables, internet fiber-optic cables, and telephone lines, in her book Networks of New York: An Internet Infrastructure Field Guide).
Yellow lines trace the flows of gas. Some yellow marks in select neighborhoods also refer to steam lines (Jeff Maki has previously chronicled the infrastructural history of some of New York City’s steam systems), as well as to the occasional petroleum pipeline. Steam lines are labeled, appropriately enough, with a yellow STM.
Another category of mark are the small colored disks of plastic embedded in the street. These are A-tags , installed in patches in the asphalt. The placement of A-tags is required in New York City whenever a utility tears up and then patches up the street, marking which utility has done the patching. In this way, not only does every patch in the asphalt carry a distinctive pattern, but also a signature.
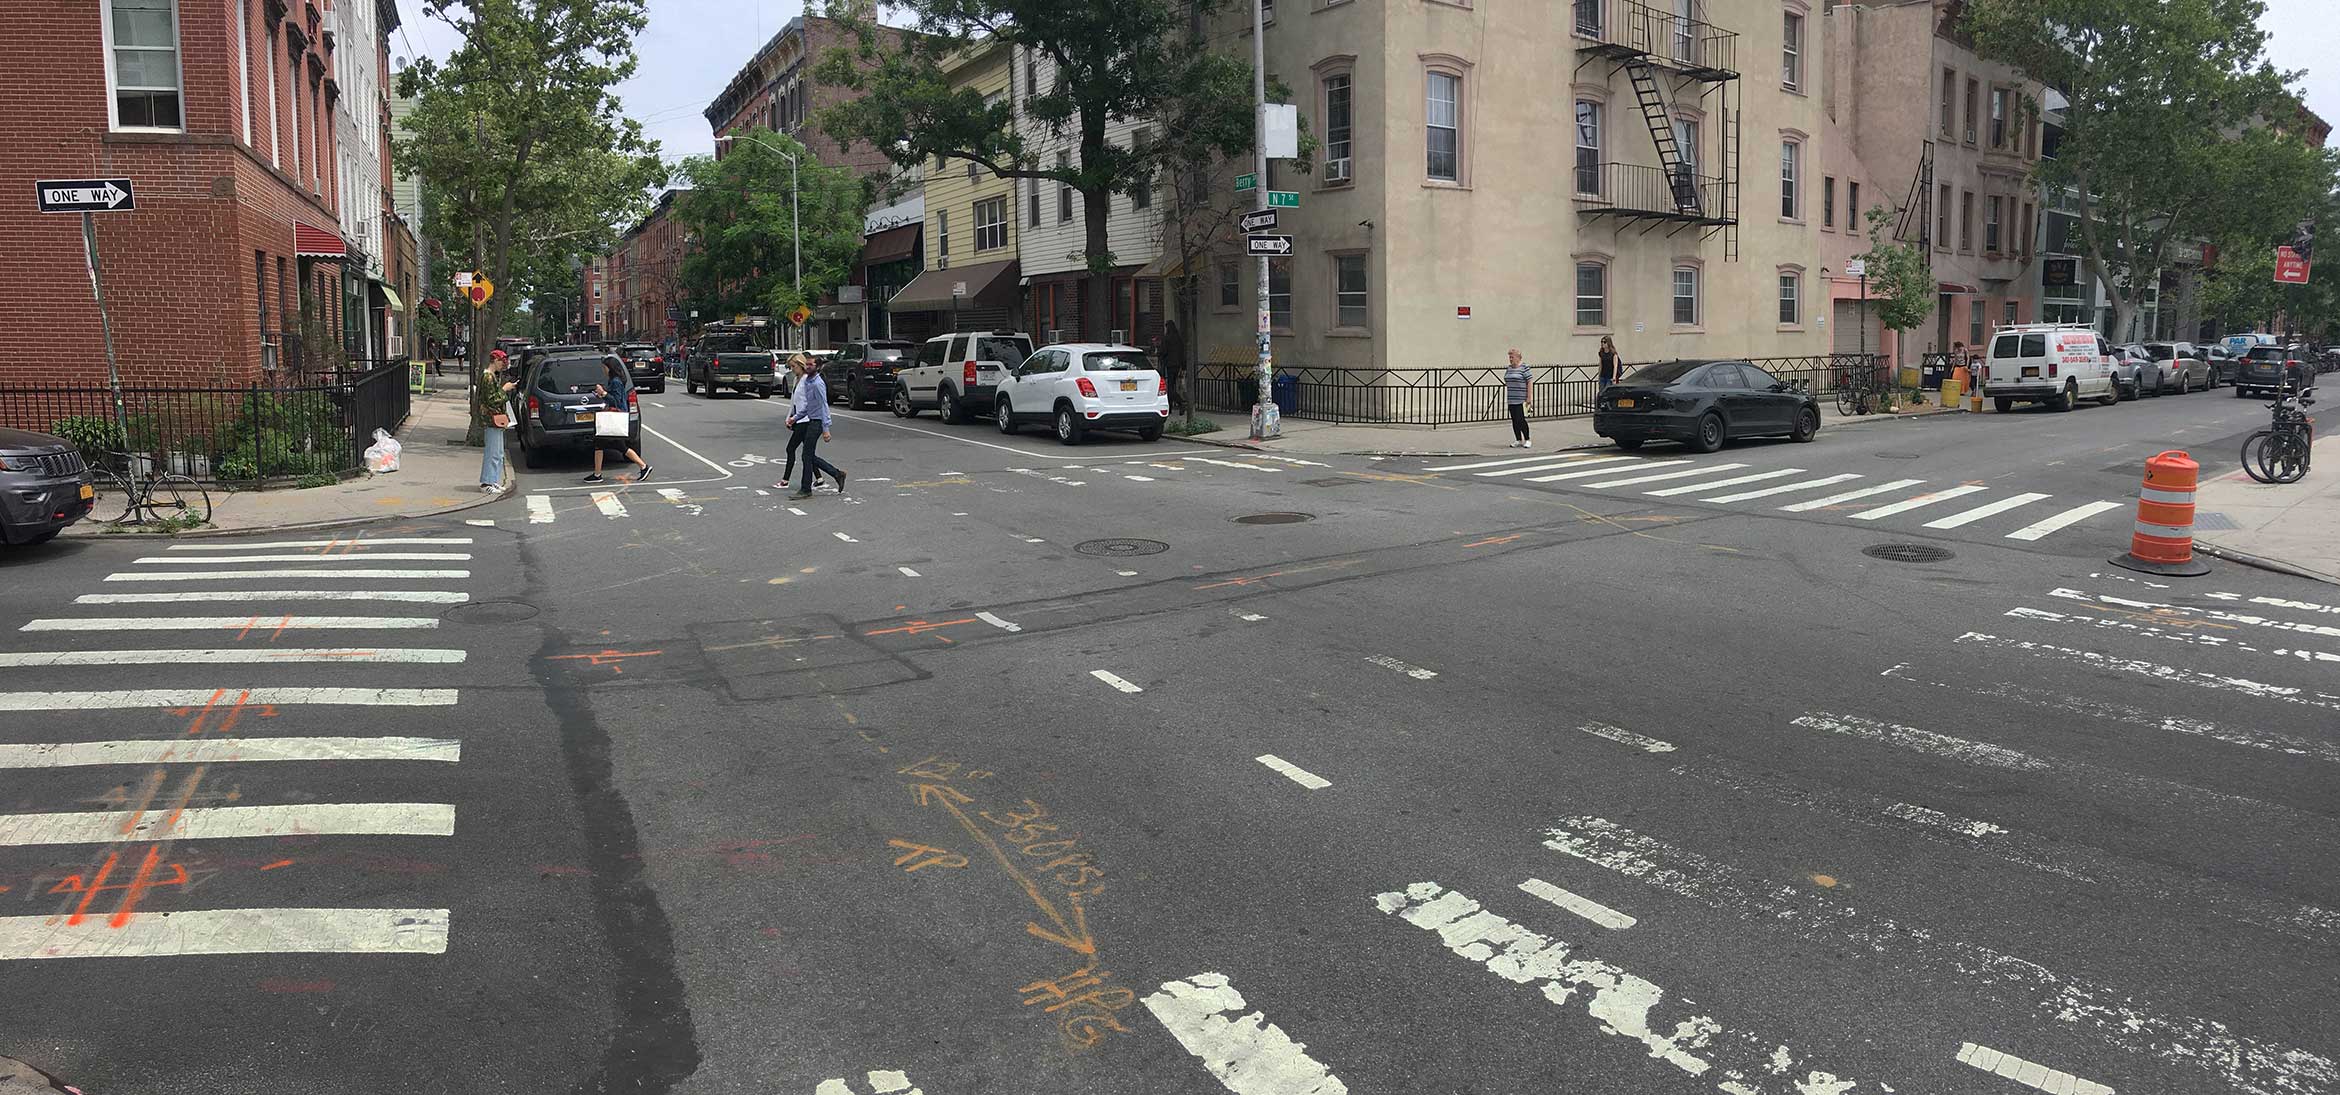
The subterranean street section is a crowded place — an “invisible city” as Lewis Mumford had observed when he sketched a drawing of the intersection of Baltimore’s Gay Street and Lombard Street back in 1908. To glimpse this complexity today, a patient observer can connect the dots between the various utility markouts, tease out the patterns of the different lines, and begin to appreciate just how many underground systems share space in a typical intersection.
A typical intersection at N. 7th and Berry Street in Brooklyn bears street level mark-outs (photographed, top, and illustrated, bottom left) that hint at infrastructure lines below (decoded, bottom right).
Blue painted lines trace the path of water mains down streets and over to fire hydrants; green lines stretch from storm drains at the curbs over to the sewer lines that run down the middle of the street.
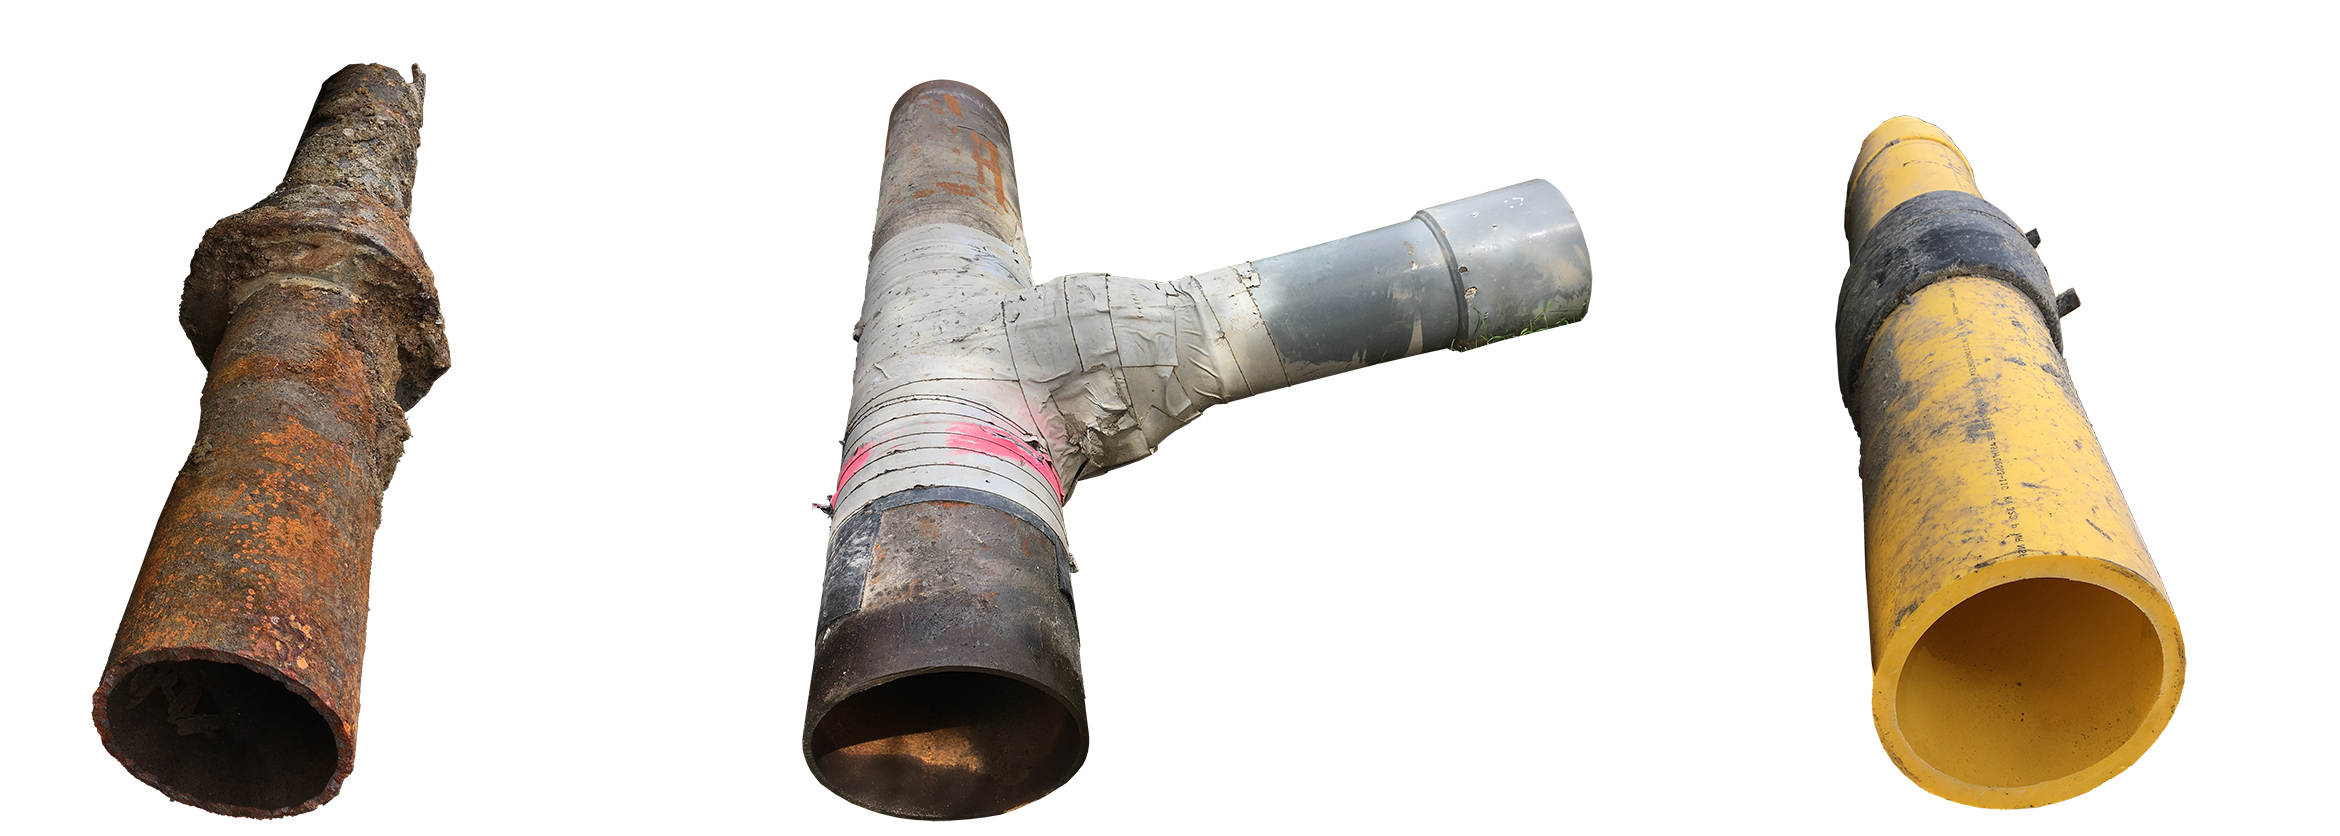
Not only do markouts tell us what infrastructural lines run where, they also give us clues to the physical materiality of these buried systems. The materials, in turn, speak to different eras of gas line infrastructure, and offer clues into the history of the pipes underfoot.
A markout might read 18” c.i, or 18” CI; this means an 18-inch-diameter cast iron main, and likely signals that the pipe in question dates to the 1850s, when both the Manhattan and the New York Gas Light Companies competed in laying 18-inch mains, before moving up to 20-inch cast iron pipes. A markout reading 24” CI would likely point to a pipe from the late 1860s, when the New York Mutual Gas Light Company began operations and pioneered the use of the massive two-foot-diameter mains. (Gas has a long history in the city; all of these 19th-century infrastructures would have been put in place to supply homes and street lamps with gaslight, before any of the thermal applications we associate it with today became standard.)
Another markout reading 6” BS, or 6” W.I., signals that the pipe in question is a small 6-inch “bare steel” or a 6” wrought iron pipe, probably dating back to before the 1960s. After the ’60s, gas companies moved away from bare steel and unprotected steel to cathodically-protected (or “coated”) steel pipe, to prevent corrosion and the associated risk of leak and explosion.
Cast iron and wrought iron are the oldest materials in use in the gas distribution system, and account for a disproportionate number of destructive incidents; for decades federal agencies such as the National Transportation Safety Board (NTSB) and Pipeline & Hazardous Material Safety Administration (PHMSA) have urged the gas distribution industry to identify and replace cast iron and wrought-iron pipes, and have tracked the incidents for which these materials have been responsible. They have done the same for bare steel pipes.
New York City’s gas distribution system is split among two utilities. Con Edison operates 2,234 miles of gas mains in Manhattan, the Bronx, and parts of northern and western Queens; National Grid has 4,128 miles of gas main in Brooklyn, Staten Island, and the rest of Queens. According to a 2014 report from the Center for an Urban Future that details the sorry state of the city’s infrastructure, cast iron or unprotected steel accounted for 48 percent of National Grid’s gas main network; they accounted for 60 percent of Con Edison’s.
Cast iron mains were originally laid in 12-foot sections, and the joints between sections are typically the places where leaks occur. To repair a joint leak, crews normally excavate down to the pipe and apply a modern sealant to reinforce the old 19th-century gasket at the seam. Repairing joints on cast-iron pipes is a game of whack-a-mole, keeping the responsible utilities continually busy.
Nobody knows for certain how much gas is escaping from the system, but recent surveys by scientists show the magnitude of the problem, which is much more extensive than either the utility companies or typical estimates acknowledge: a street-level survey in 2015 documented at least 1000 individual leak locations — roughly in line with the documented leak rates in other old East-Coast cities like Washington, Philadelphia, and Boston. Similarly, a 2013 ground-level leak report commissioned by the nonprofit Damascus Citizens for Sustainability found thousands of leaks throughout Manhattan, with an estimated total leakage rate above five percent.
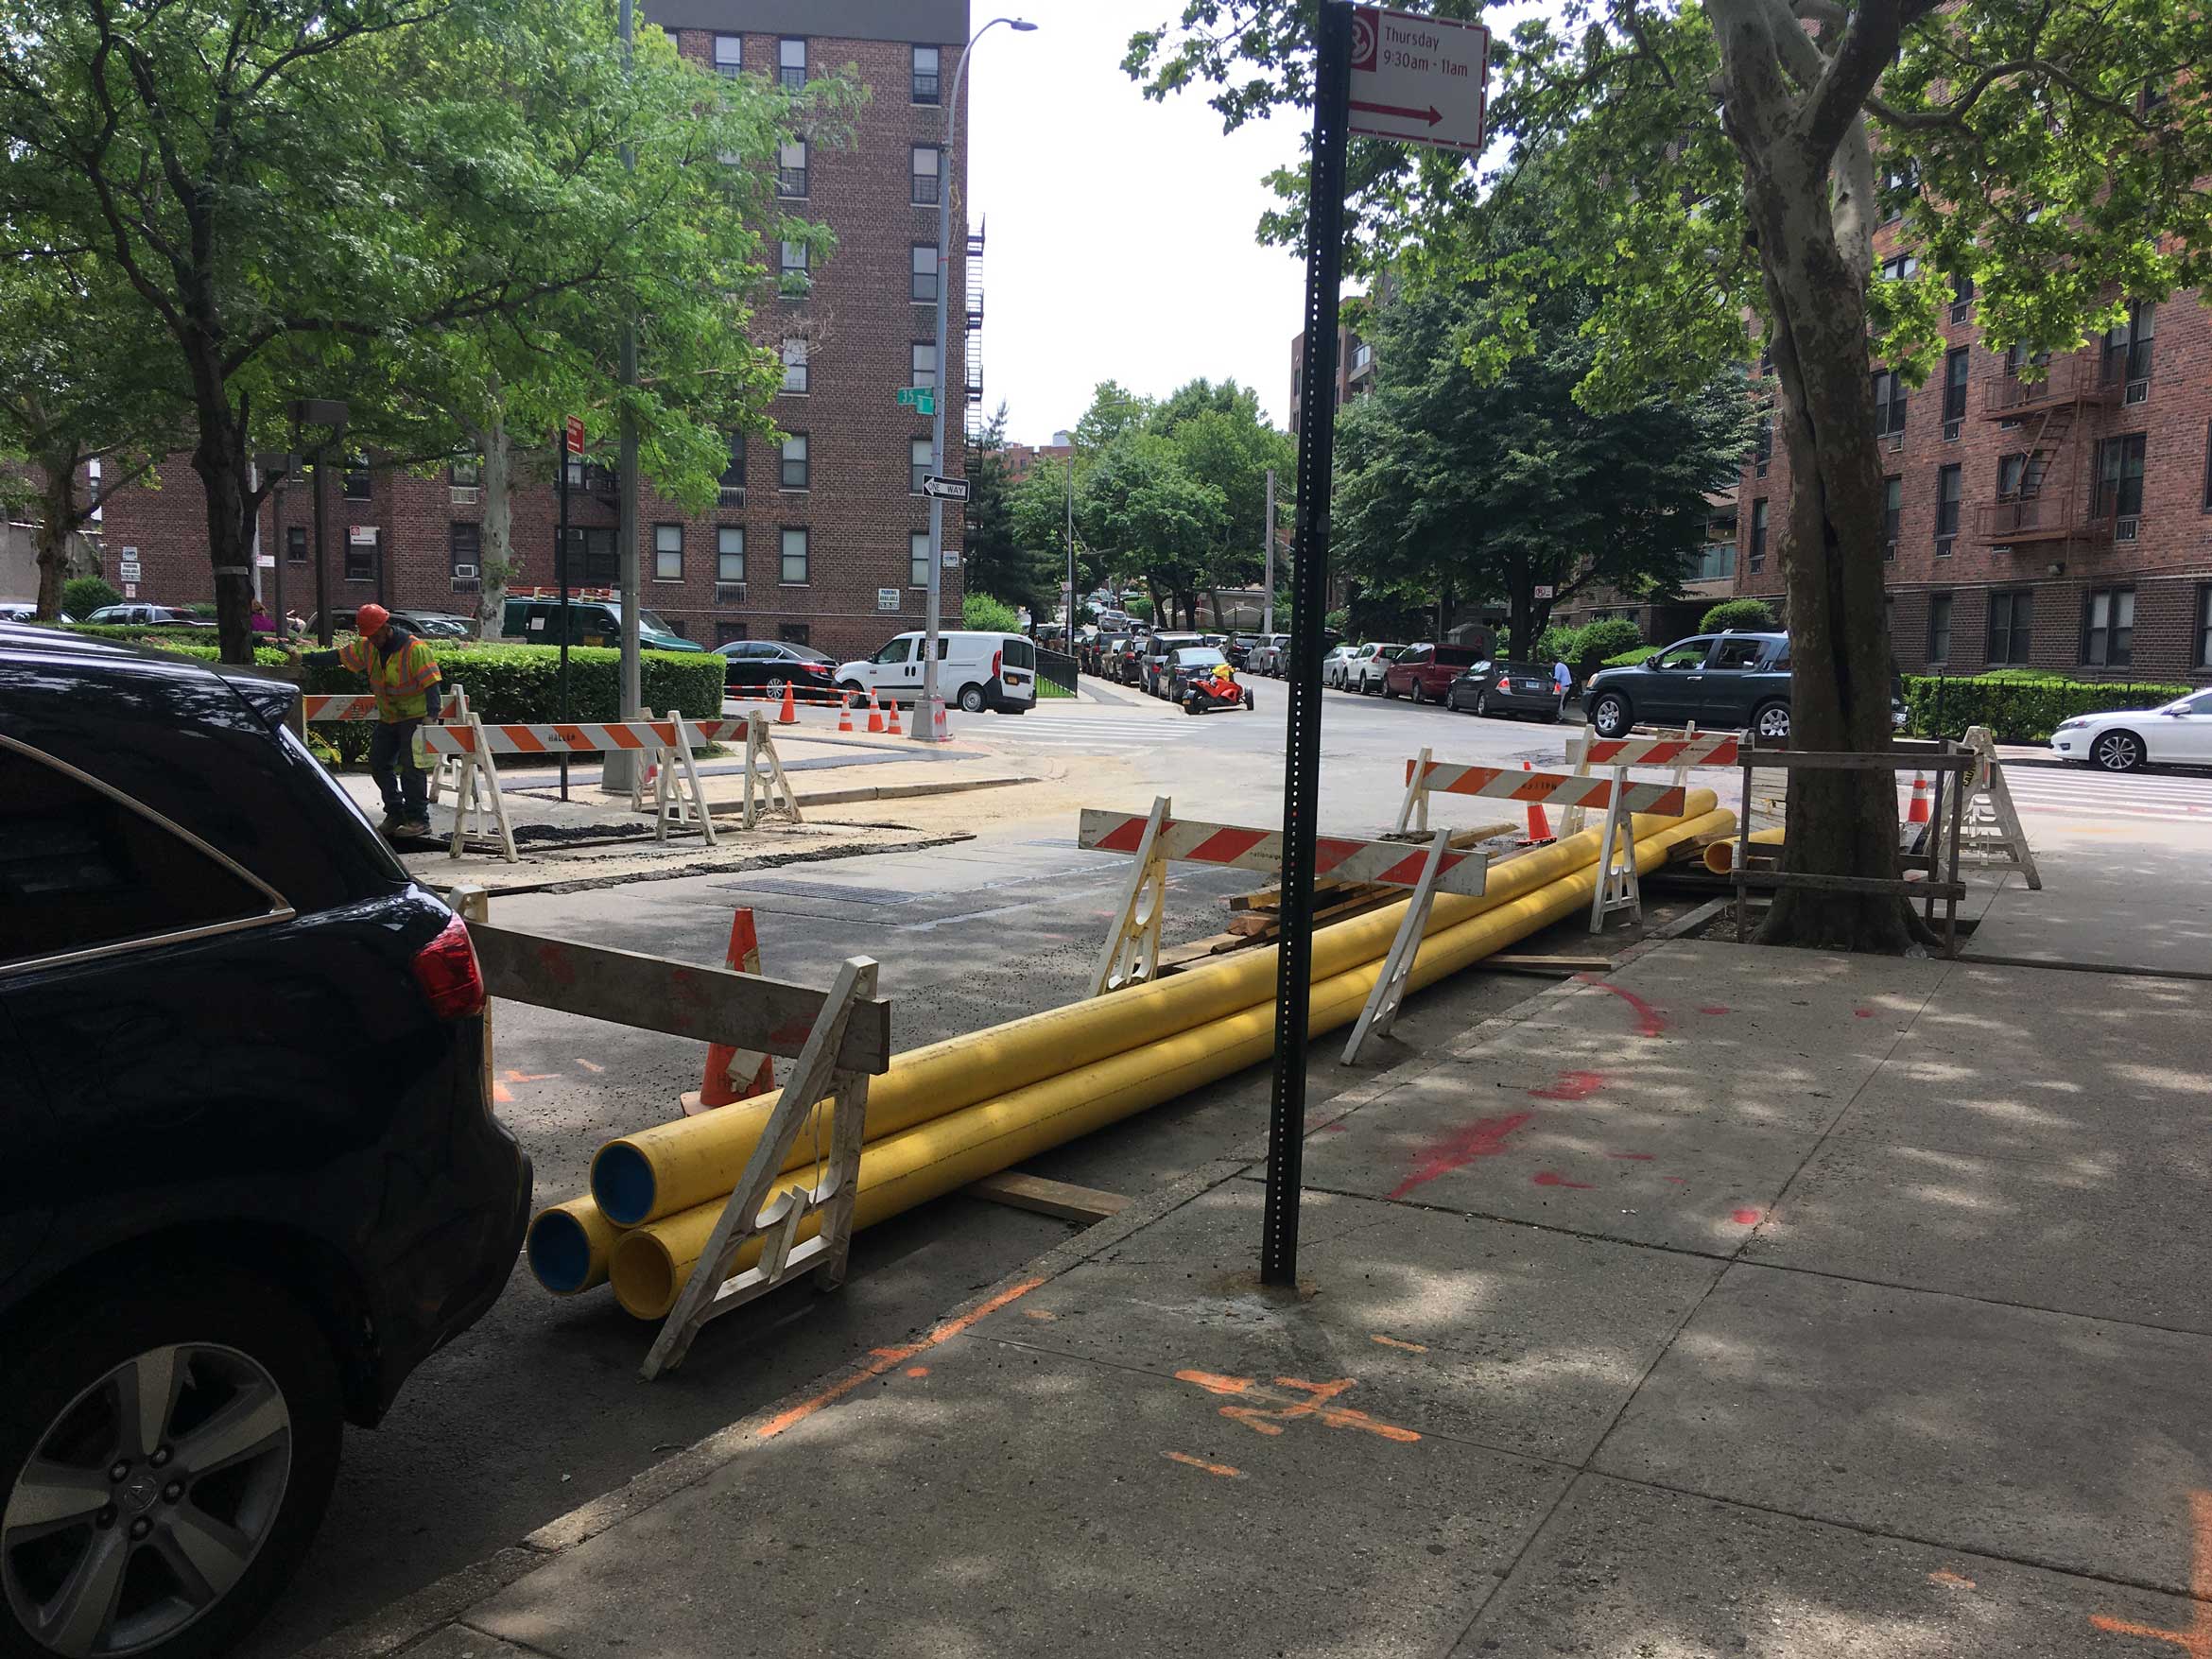
Today New York’s two utilities are gradually replacing their leak-prone cast iron, wrought iron, and unprotected steel pipes, primarily with bright yellow plastic ones. One often encounters these yellow polyethylene cylinders stockpiled near street excavation sites, waiting to be swapped out. It is slow work; despite committing to 70 miles per year of pipe replacement, the work is still scheduled to take almost three decades — slower than some advocates would like.
As authors of the 2015 survey note, other cities such as Cincinnati have tackled pipe replacement on a much more aggressive schedule. In Cincinnati, Duke Energy instigated a 10-year, $700 million program to replace 1,200 miles of legacy pipe, resulting in one of the lowest gas leak rates in the country. Manhattan has an average of 4.25 leaks per roadway mile, compared to only 0.47 leaks per mile in Cincinnati.
There are many factors that complicate such an accelerated program in New York City — among them the traffic congestion, difficulty of permitting, and cost of working in the city — but beyond the promise of fewer explosions, there is another compelling reason to push for aggressively replacing the antiquated infrastructure: greenhouse gas emissions.
Since natural gas is predominantly methane, and since methane is a very potent greenhouse gas when it escapes into the atmosphere unburned (about 84 times worse than CO2 over the short term), leaks from the city’s gas outdated distribution system are a serious problem that haven’t received enough attention. Even when they’re not exploding, cast iron pipes are more prone to persistent gas leaks than their newer counterparts; when there are thousands of individual leaks in a system, these begin to add up. The materiality of the lines, it turns out, has a direct impact on the climate change contribution of the city’s natural gas system. In an article titled The Methane Beneath Our Feet, climate activist Bill McKibben put New York’s leaks into context within the larger impact of the natural gas boom on U.S. emissions. “Given the vastness of the problem,” McKibben concludes, “the leaks challenge some of the basic assumptions of current US energy policy, which has aggressively endorsed natural gas as a ‘clean’ and climate-friendly alternative to oil and coal.” In terms of climate benefits of natural gas compared to coal, it’s all about the leak rate, and the preliminary studies for New York, with their estimate in excess of five percent, are not looking good.
Gas is ubiquitous, with most buildings connected to the system by way of stoves and ovens, hot water heaters and gas-fired furnaces. But the dramatic short-term emissions impacts of methane have led some climate advocates (and even some planning organizations such as the Regional Plan Association) to campaign for moving more rapidly away from gas, while the so-called “electrify everything” movement argues for full electrification as soon as possible. The idea is that it is much easier to transition centralized power plants to renewable energy in a shorter period of time than to mandate changes to millions of individual devices and appliances. But gas use in New York is rising despite growing realization of its climate risks.
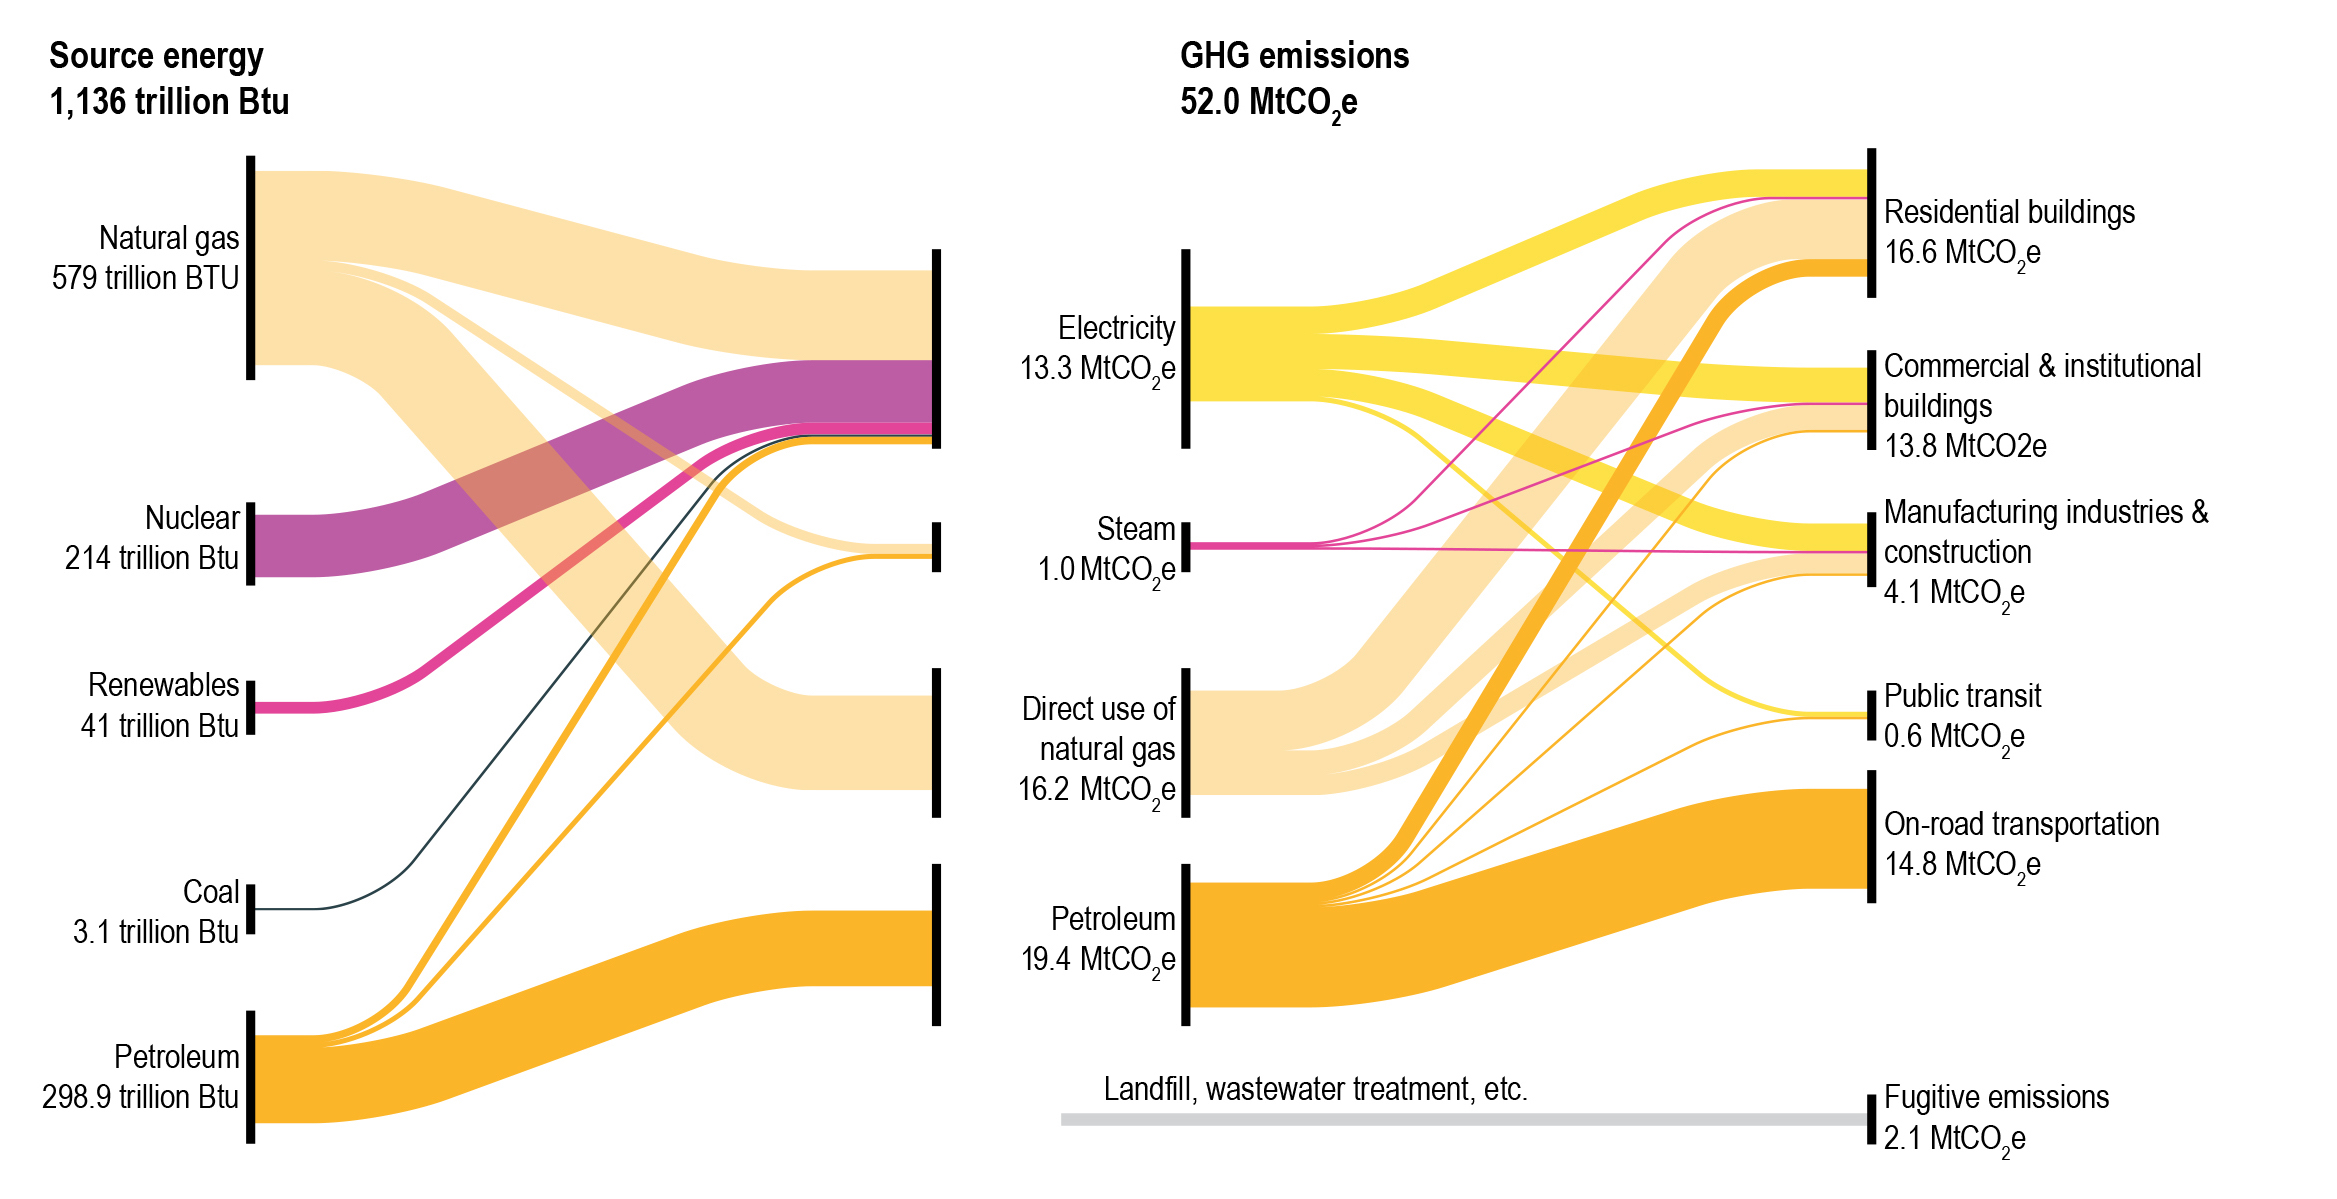
Perversely, New York City’s increasing dependence on natural gas comes as a result of its goal of leading on emissions reductions; in its most recent Inventory of Greenhouse Gases, the New York City Mayor’s Office of Sustainability stated that “in the first five years of tracking the city’s emissions, the most significant driver behind GHG emissions reductions was the switching of the fuel source for electricity generation from coal to natural gas.” But now, natural gas is the largest source of greenhouse gas emissions in New York City. Well over half of the city’s electricity is derived from burning natural gas; even more of its emissions come from the direct use of gas in buildings and manufacturing, which has grown 25 percent between 2005 and 2015, as buildings replace dirty particulate-producing heating oils like #4 and #6 heavy fuel oils, to comply with New York City’s phaseout plan. Some of the city’s newest buildings, from hospitals and universities to hotels and luxury apartment buildings, are installing gas-fired microturbines — akin to small jet engines in a box, ranging in size from that of a refrigerator to that of a shipping container — to add energy redundancy in case of power failures.
When the gas system in New York City was still young, it was a source of wonder and conflict: Massive aboveground gasholding and gas manufacturing infrastructures, aggressive excavation work, and continually torn-up streets harbingered both progress and annoyance. Having settled into middle age, the city’s gas distribution infrastructure now lies quietly buried, give or take the occasional gas explosion. But as our focus increasingly turns to infrastructure and to climate change, the gas system must emerge from the background and take a more prominent place in the planning and design of the city.
As New York pushes to decarbonize further, in pursuit of the goal of reducing emissions 80 percent by 2050, the city would do well to begin to pay increased attention to its gas addiction, to the physical pieces of the gas system, and to the fine-tuning of its storied and aging parts.
All images by the author unless otherwise noted.
The views expressed here are those of the authors only and do not reflect the position of The Architectural League of New York.


Comments