


Series
The Location of Justice
An examination of the pervasive and often overlooked infrastructure of criminal justice in New York and the spaces that could serve a more just city.
In This SeriesWe are celebrating 15 years — and counting — of stories that are deeply researched and deeply felt, that build a historical record of what the city has been.
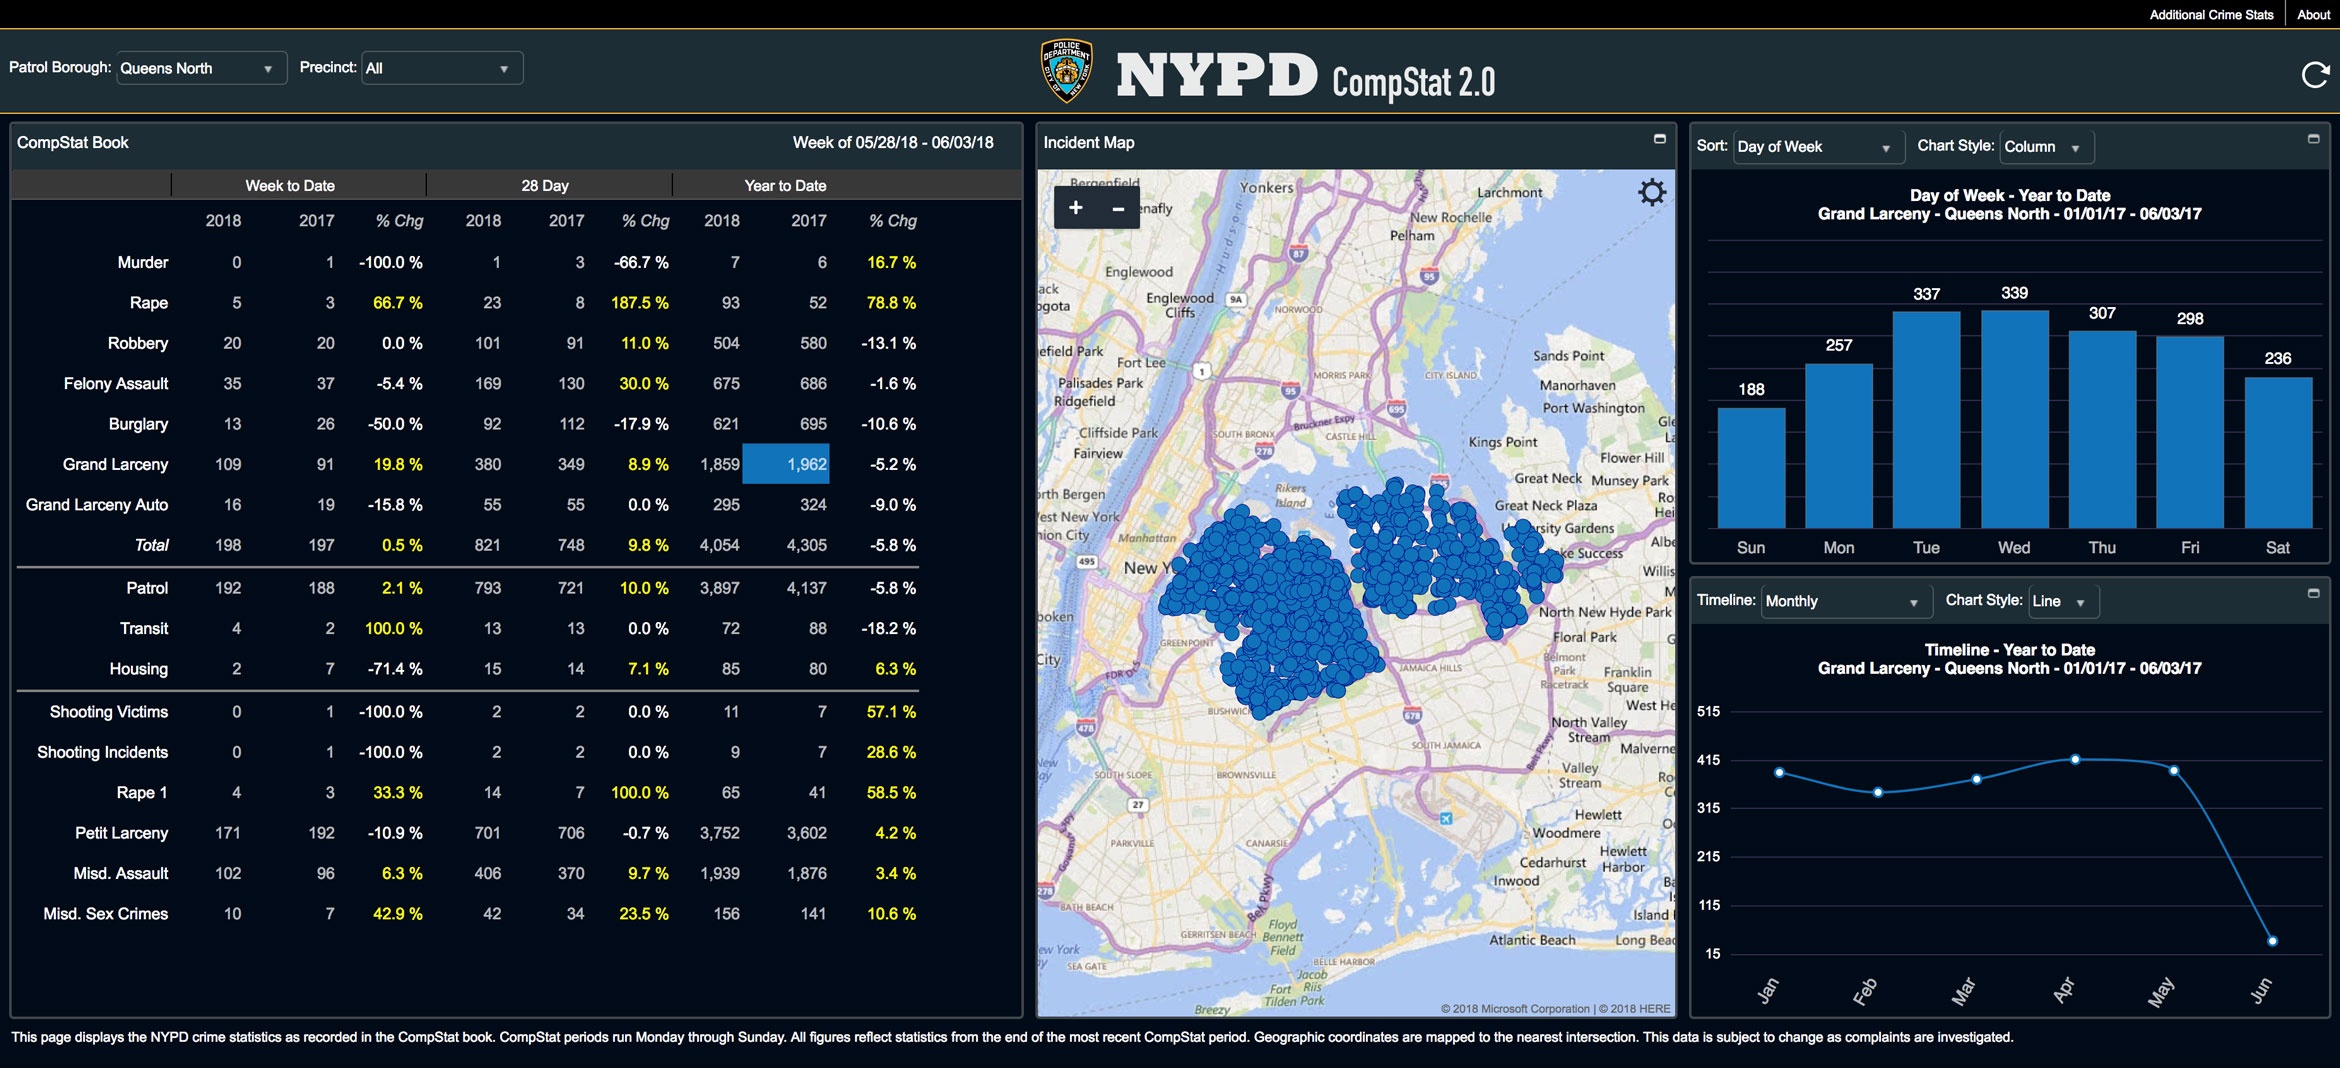
A multi-billion-dollar industry of data-driven policing technology includes dozens of mapping, surveillance, and data-analysis tools, each claiming to hone in on crime at ever-finer grain. But as data and infrastructure writer Ingrid Burrington argues here, these technologies represent less a science for the provision of safety, and more a highly effective sales pitch for a management model born in the zero tolerance Giuliani era. Since the early 1990s, when precinct commanders pushed pins into paper maps, police in New York have contended that if they can track crime, then they can predict it, and therefore prevent it. The maps they’ve made have monopolized media narratives, and shaped the lives of those who live within their frames. The authors of CompStat now export their methods around the world. (Burrington maps the “CompStat evangelist consultant world tour” here.) Business is good for those technology vendors and consultants who sell crime- and fear-reduction as a customer service. (Burrington also takes stock of the available tools in an illustrated, non-exhaustive taxonomy here.) But who’s buying? More than a set of tools, crime mappers hawk a model of a future world where the cost of guaranteed order would be accountability to the public.
Policing and urban planning have a lot in common. Both cops and planners’ ostensible goal is to make the city a more livable place, though this goal is constantly haunted by a question: Livable for whom? Both transform a public’s experience of a city, generally by imposing and enforcing rules and systems that change how people move through space. In the United States, public understanding of both professions is to some extent influenced by romanticized media narratives which heavily emphasize cities like Los Angeles and New York. Both sectors have a particularly heavy fetish for maps and data as mechanisms for understanding and shaping cities, a fetish that has intensified in the past few decades thanks to advances in technology.
Where the two professions diverge starkly is in matters of time and violence. Where urban planning might be considered a slower, bureaucratic, deliberative process, policing is expected to engage with and respond to city conditions and events in real time — or, increasingly, ahead of time. And unlike urban planners, cops are permitted to respond with firearms and Tasers.
That being said, planning is fully capable of enacting slower, more systemic acts of violence onto a city, and like policing, such violence can be enabled and plausibly denied by sufficiently complex data and maps. Where the urban planner has eminent domain and urban renewal, the police officer has crime hotspots and risk terrain modeling. Where a planner might control a city through highway design and traffic flows, a police department’s automated license plate readers or mobile cell site simulators render public movement into potential patterns of criminal behavior.
Police departments often frame these methods of spatial analysis, data collection, and networked surveillance as not only necessary, but relatively benign tools that departments have been using for years. “Policing has always been an information business,” notes a 2015 NYPD document on information technology programs. This observation comes toward the end of an outline of exciting new developments in the department’s use of tech to fight crime. These initiatives vary from advances that seem quaint (giving every NYPD officer an email address!), to heavy infrastructure development, to extensive additions of sensors and surveillance tools throughout the city.
Of course, as tremendous instruments of power and violence, maps have been used by police (agents of the former, authorized to hold a monopoly on the latter) for decades. But in the 1990s, the emergence of desktop GIS software for and in police departments dramatically increased the data collection and storage capacities of that “information business.” The technology’s adoption coincided with the era of NYPD Commissioner Bill Bratton and his avuncular lieutenant Jack Maple. This is where many histories tend to pinpoint the transformational moment for crime mapping: Bratton and Maple tracking turnstile jumpers in the New York City subway system, Maple outlining a four-point theory of policing management on a napkin at Elaine’s restaurant (“Accurate, timely intelligence; rapid deployment, effective tactics; relentless follow-up and assessment”), New York’s crime rate precipitously falling thanks to the data-driven innovations of CompStat.
This legend would prove to be both the downfall and redemption of Bratton, Maple, and their colleague John Timoney. While media adulation of Bratton’s NYPD infuriated Mayor Rudolph Guiliani to the point that he forced Bratton out a mere two years into his lauded transformation of the city, it would become the calling card used by all three to establish public legacies as experts in the science of crime-fighting.
This particular version of data-driven policing history, starring Bratton and his colleagues, uses its larger-than-life characters and conveniently selective statistics to obfuscate the public harms created by introducing new data-driven technologies and policies into policing, and the ambiguity about whom these tactics are supposed to benefit. The political intrigues of City Hall and One Police Plaza, the personalities (and egos) in Bratton and Guiliani’s inner circles, and the precipitous drops in crime during Bratton’s tenure (New York City’s murders dropped almost by half, from 1,951 in 1993 to 983 in 1996) provide ample distraction from the technology itself, the fact that no one seems able to decide what the word “CompStat” actually means, and the ongoing debates over whether the tactics Maple apocryphally outlined on a napkin were in fact responsible for a drop in crime. Since 9/11, other technology and surveillance tools have benefitted from a similar tendency to foreground mythology over evidence of impact and threats to civil liberties.
As data-driven policing has gone from novel tactic to entrenched strategy, maps have helped legitimize and (literally and figuratively) ground mythologized versions of cities. To understand the spatial history of modern networked surveillance and policing, one could do worse than to look at the cartographic and rhetorical maps used and created by the NYPD over the past few decades, starting with its own founding mythologies of modern crime mapping.
The first CompStat maps were made with pins, paper, and transparent acetate. The NYPD technically didn’t have the budget to support their cost, so the New York City Police Foundation provided a $10,000 donation. Although the department would eventually switch to computerized maps, displayed on eight foot-by-eight foot screens in One Police Plaza, the image of police officers fumbling with pushpins and acetate film they could barely afford suggests a surprisingly scrappy origin story for a management strategy so often associated with precision and technical expertise — even if its own name is both vague and technically meaningless.
None of CompStat’s historians can decide if it is shorthand for “computational” or “comparative” statistics, nor do any of them seem to think that etymology matters. It’s more often described as management strategy than technology innovation, and in New York perhaps its greatest legacy was as armature for political theater.
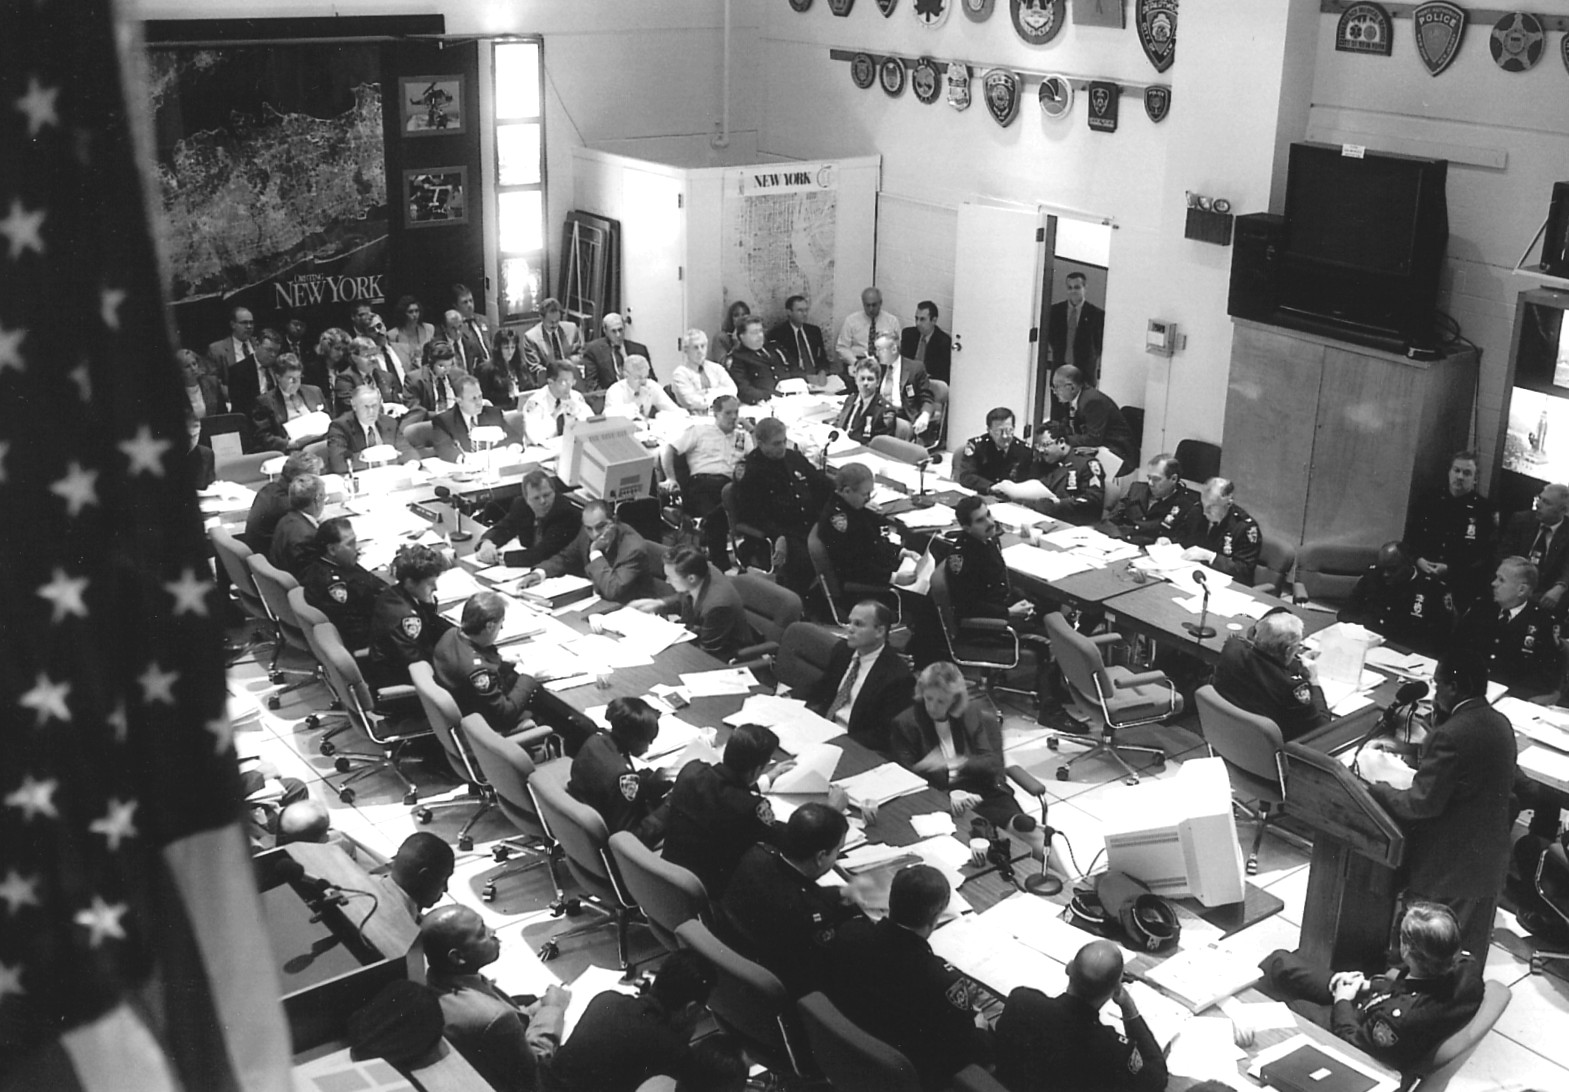
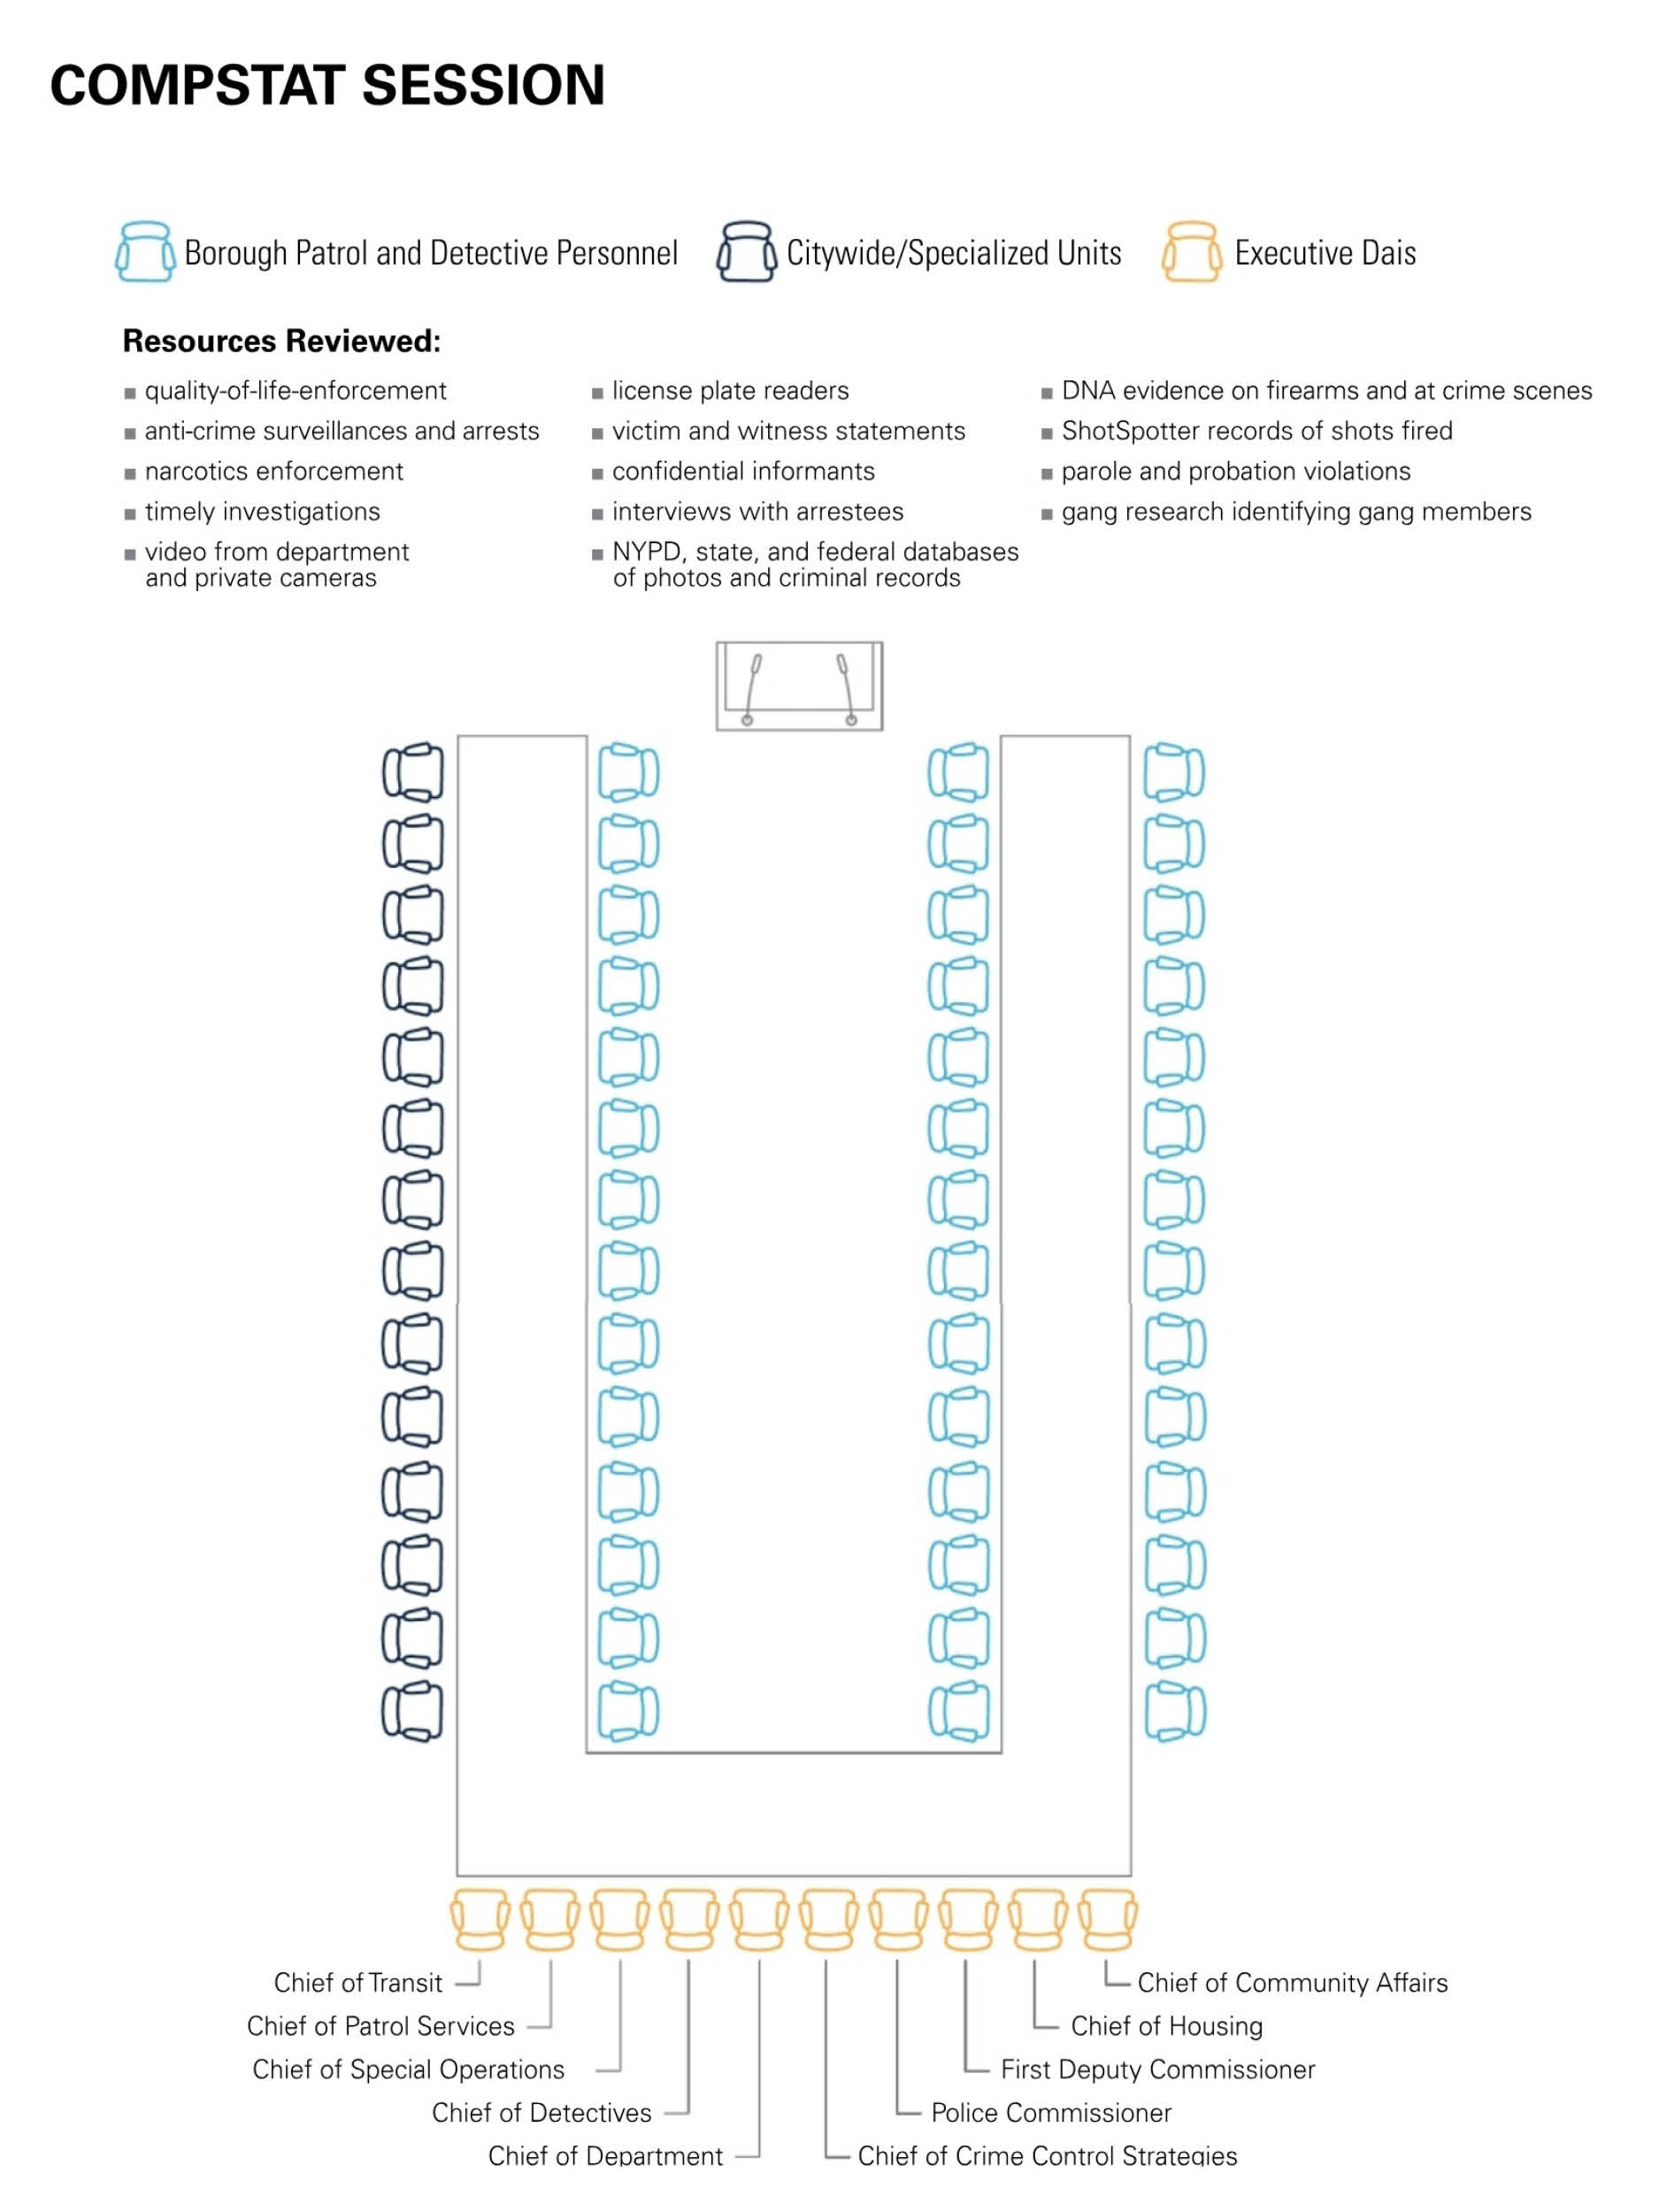
In 1994, CompStat publicly manifested primarily as a twice-weekly meeting in which the highest-level figures of NYPD management grilled precinct commanders over the minute details of their local crime numbers. The meetings, held at One Police Plaza, developed a reputation thanks to the frequently childish bullying tendencies of NYPD leadership. Name-calling and chair-throwing were regular occurrences; in one frequently-cited incident at the time, during a presentation by Brooklyn South borough commander Tony Simonetti an illustration of Pinocchio was displayed on the eight-by-eight screens to imply he was lying about crime-fighting efforts under his jurisdiction.
The CompStat meeting format bears more relationship to a corporate board presentation with VPs delivering quarterly sales numbers, a fact noted early on by reporters. A 1994 New York Times article headlined “Boardroom Tactics Utilized in the War on Crime” noted that Bratton often utilized “corporate metaphors.” The Times reported, “’We have a lot to learn from the private sector,’ he said. ‘We’re looking at the customer — the public — to see what his needs are. We’re looking at the product. Does it meet the customer’s needs. If not, we’re going to change the product and change the entity that creates the product. The profit I’m looking for is reduced crime, reduced fear.'”
The technical foundation of CompStat also emerged from retrofitting private sector tools, including that aforementioned anodyne name. One version of CompStat’s history attributes its origins to the department’s ancient IBM floppy disks, which had such limited storage space that filenames could only be eight characters. “Compstat” was a placeholder name chosen on a whim and in a rush for a rudimentary database made in Informix’s SmartWare, an off-the-shelf database product marketed to small business owners.
It makes sense that most of the technology deployed by the NYPD in the 1990s amounted to hacks on products not designed for police departments. Off-the-shelf commercial software for police departments didn’t exist. The emergent market for off-the-shelf GIS software (the NYPD happened to use MapInfo) emphasized business applications because that’s who would pay for software. But as Bratton and Maple’s NYPD aggressively promoted their data-driven approach, companies and vendors emerged to bring even more private-sector expertise to policing. Today, CompStat itself has become a mutable corporate product deployed across the public sector. Aside from other police departments adopting it, we see Mayor Bill de Blasio calling for a CompStat for the MTA, a CompStat for public claims against the city, and a “CompStat for Prescription Drug Abuse.”
And, like most private sector initiatives, CompStat’s greatest victory may manifest more in a bottom-line set of numbers than the realities of any citizen’s quality of life. In a 2010 survey of 491 retired NYPD officers conducted by criminologists Eli Silverman and John Eterno (also a retired NYPD captain who worked directly on innovative mapping projects in the department), dozens of officers expressed deep skepticism about the accuracy of CompStat numbers and described internal pressure from superiors to manipulate crime numbers, a practice well-documented by former officer Adrian Schoolcraft while working in Bedford-Stuyvesant’s 81st Precinct around the same time. The department and NYPD commissioner balked at the survey results and Schoolcraft’s exposé, insisting that measures for maintaining accurate statistics were strictly enforced. (In 2013, those practices would become a liability when the department was sued over its controversial stop-and-frisk policies.)
While they rose to prominence around the same time, CompStat is not exactly the same as “broken windows” policing, Bill Bratton’s other beloved innovation. There’s nothing about the collection and sharing of increasingly granular data about cities and crime that inherently requires an increasingly granular focus on vandalism, public urination, or other so-called “quality of life” issues, but the pursuit of metrics and of minor offenses proved symbiotic. More attention to previously overlooked “quality of life” arrests meant more arrests to keep track of, which meant creating more data, which meant creating workflows for managing that data.
Broken windows theory is also part of what made the NYPD’s data-driven strategy so inherently spatial, and its tangible, spatial returns are what make it such an appealing media narrative. The systemic origins of poverty, crime, and civil unrest are big, tangled, and hard to locate in the immediate here-and-now of a city street corner or a subway platform. A policing approach focused on the corner, the subway platform, and things that a public can see (and, in the case of the media, photograph and file on deadline) at least creates the appearance that those systemic problems have been resolved.
But, as critics point out, quality of life policing tends to prosecute the victims of systemic harms, not its perpetrators. Rather than asking what economic conditions led a teenager to jump a turnstile, it assumes that removing the turnstile-jumper will itself solve the problem of criminal activity on the subway. It also assumes a facile theory of change, ignoring the myriad of other data points that contribute to the rise and fall of crime (from the economy, to the weather, to rates of drug use, to access to social services).
Beyond the minutiae of the pushpin crime map, broken windows serves other cartographic interventions, remapping crisis away from systemic paradigms of City Hall, Wall Street, and Washington onto Midtown South, Crown Heights, and subway turnstiles. The measure of public order becomes a matter of metrics — the number of quality-of-life arrests, the meeting of expectations set in CompStat meetings.
Eager to sell their services as paradigm shift, the architects of data-driven policing promoted the idea that the history of the strategy all began with New York. Few departments so aggressively positioned themselves at the forefront of technical innovation quite like the NYPD, and few modern police chiefs have had as outsized a public persona as Bill Bratton.
Bratton had a vested interest in CompStat becoming a nationally recognized model for police management — not only as a matter of personal pride after leaving the department, but also as a matter of professional ambition. Bratton and other key figures of his leadership team (Maple, Timoney, Louis Anemone, John Linder, and Robert Wasserman, among others) built lucrative careers in police department consulting after their success at the NYPD. Both Bratton and Timoney would move back and forth between consulting and working as police chiefs (in LA and New York again for Bratton; Philadelphia and Miami for Timoney) following their departure in 1996. Any map of the CompStat evangelist consultant world tour is doomed to be incomplete; documentation of these jobs mostly exists in magazine profiles, regional news mentions (usually up in arms about cities paying the consultant’s exceptionally high fees), or as case studies in Bratton, Maple, and Timoney’s respective memoirs.
Those books are light on specific IT product recommendations. They do offer some insight into what the three men consider policing best practices (information sharing is good, as is basically anything they decided to do), what the media and politicians get wrong about stopping crime (usually, everything), and the psychology of the national-stage supercop (self-deprecating working-class humor covers for entitled, defensive aggrievement at the public’s apparent mistrust). All three insist in their personal definitions of CompStat that it is, above all else, an instrument of police accountability — albeit accountability by way of a trickle-down logic. Making precinct commanders more accountable to top brass meant beat cops were more accountable to precinct commanders, which meant beat cops were more accountable to citizens. It was at times a blunt instrument, but as Bratton observed, “CompStat was police Darwinism; the fittest survived and thrived.”
Sea changes in policing and technology that had little to do with the NYPD or its three superstars typically remain absent from these narratives. There wasn’t anything uniquely “New York” about using data or GIS in the 1990s; nor was there anything uniquely “New York” to broken windows policing. The idea of making maps or using statistics to monitor crime patterns is an old one, and in terms of a legacy of technological innovations, Southern California could arguably give the NYPD a run for its money. The LAPD pioneered helicopter-based aerial surveillance in the 1960s, and in the late ‘80s, San Diego became the first police department to use CalGang, the statewide gang database tool whose model (and controversial application, most recently used in enabling ICE deportations) has been replicated by cities across the country.
Many of these innovations drew on newly available federal resources. The 1994 Violent Crime Control Act (better known as “the Clinton crime bill”) explicitly allocated federal funding to support the hiring and training of more police officers in cities through the Community Oriented Policing Services (COPS) office. COPS and the Department of Justice also supported research into the use of emerging technology to support policing. A 1999 report on crime mapping from the Department of Justice notes a number of federal partnerships and funding opportunities for expanding “data-driven management” in police departments.
The Department of Justice’s 1999 crime mapping report echoes another point from Bratton, Timoney, and Maple: technological interventions are only meaningful with excellent leadership and community engagement. The crime map is made meaningful by its cartographers, but also by departmental navigators who deploy officers based on these maps. In Bratton and Timoney’s cases, this apparently meant misclassifying crimes to produce the appearance of a declining crime rate and deploying severely disproportionate force against protestors at major demonstrations. By positioning themselves as thought leaders in policing innovation, Bratton and his NYPD leadership set much of the tone for what would become commonplace practices in contemporary data-driven policing: a high-level faith in metrics as a tool for accountability, a pursuit of a vaguely defined and subjective standard for “quality of life,” and an insistence that the media and government always, always didn’t understand.
Of course, another major event was about to transform modern American policing after Bratton’s heyday. 9/11 introduced new counterterrorism mandates and new federal funding resources to American cities, and the NYPD starred in public narratives of post-9/11 policing innovation, in which counterterrorism served as a pretext for increased surveillance, mapping, and data collection — particularly on Muslim populations, but effectively on dozens of others. With the suspension of traditional legal oversight over surveillance, the NYPD Intelligence Bureau expanded the geography of threats to public disorder beyond the broken window and inside the perfectly-maintained façades of mosques, restaurants, and internet cafés in predominantly Muslim communities.
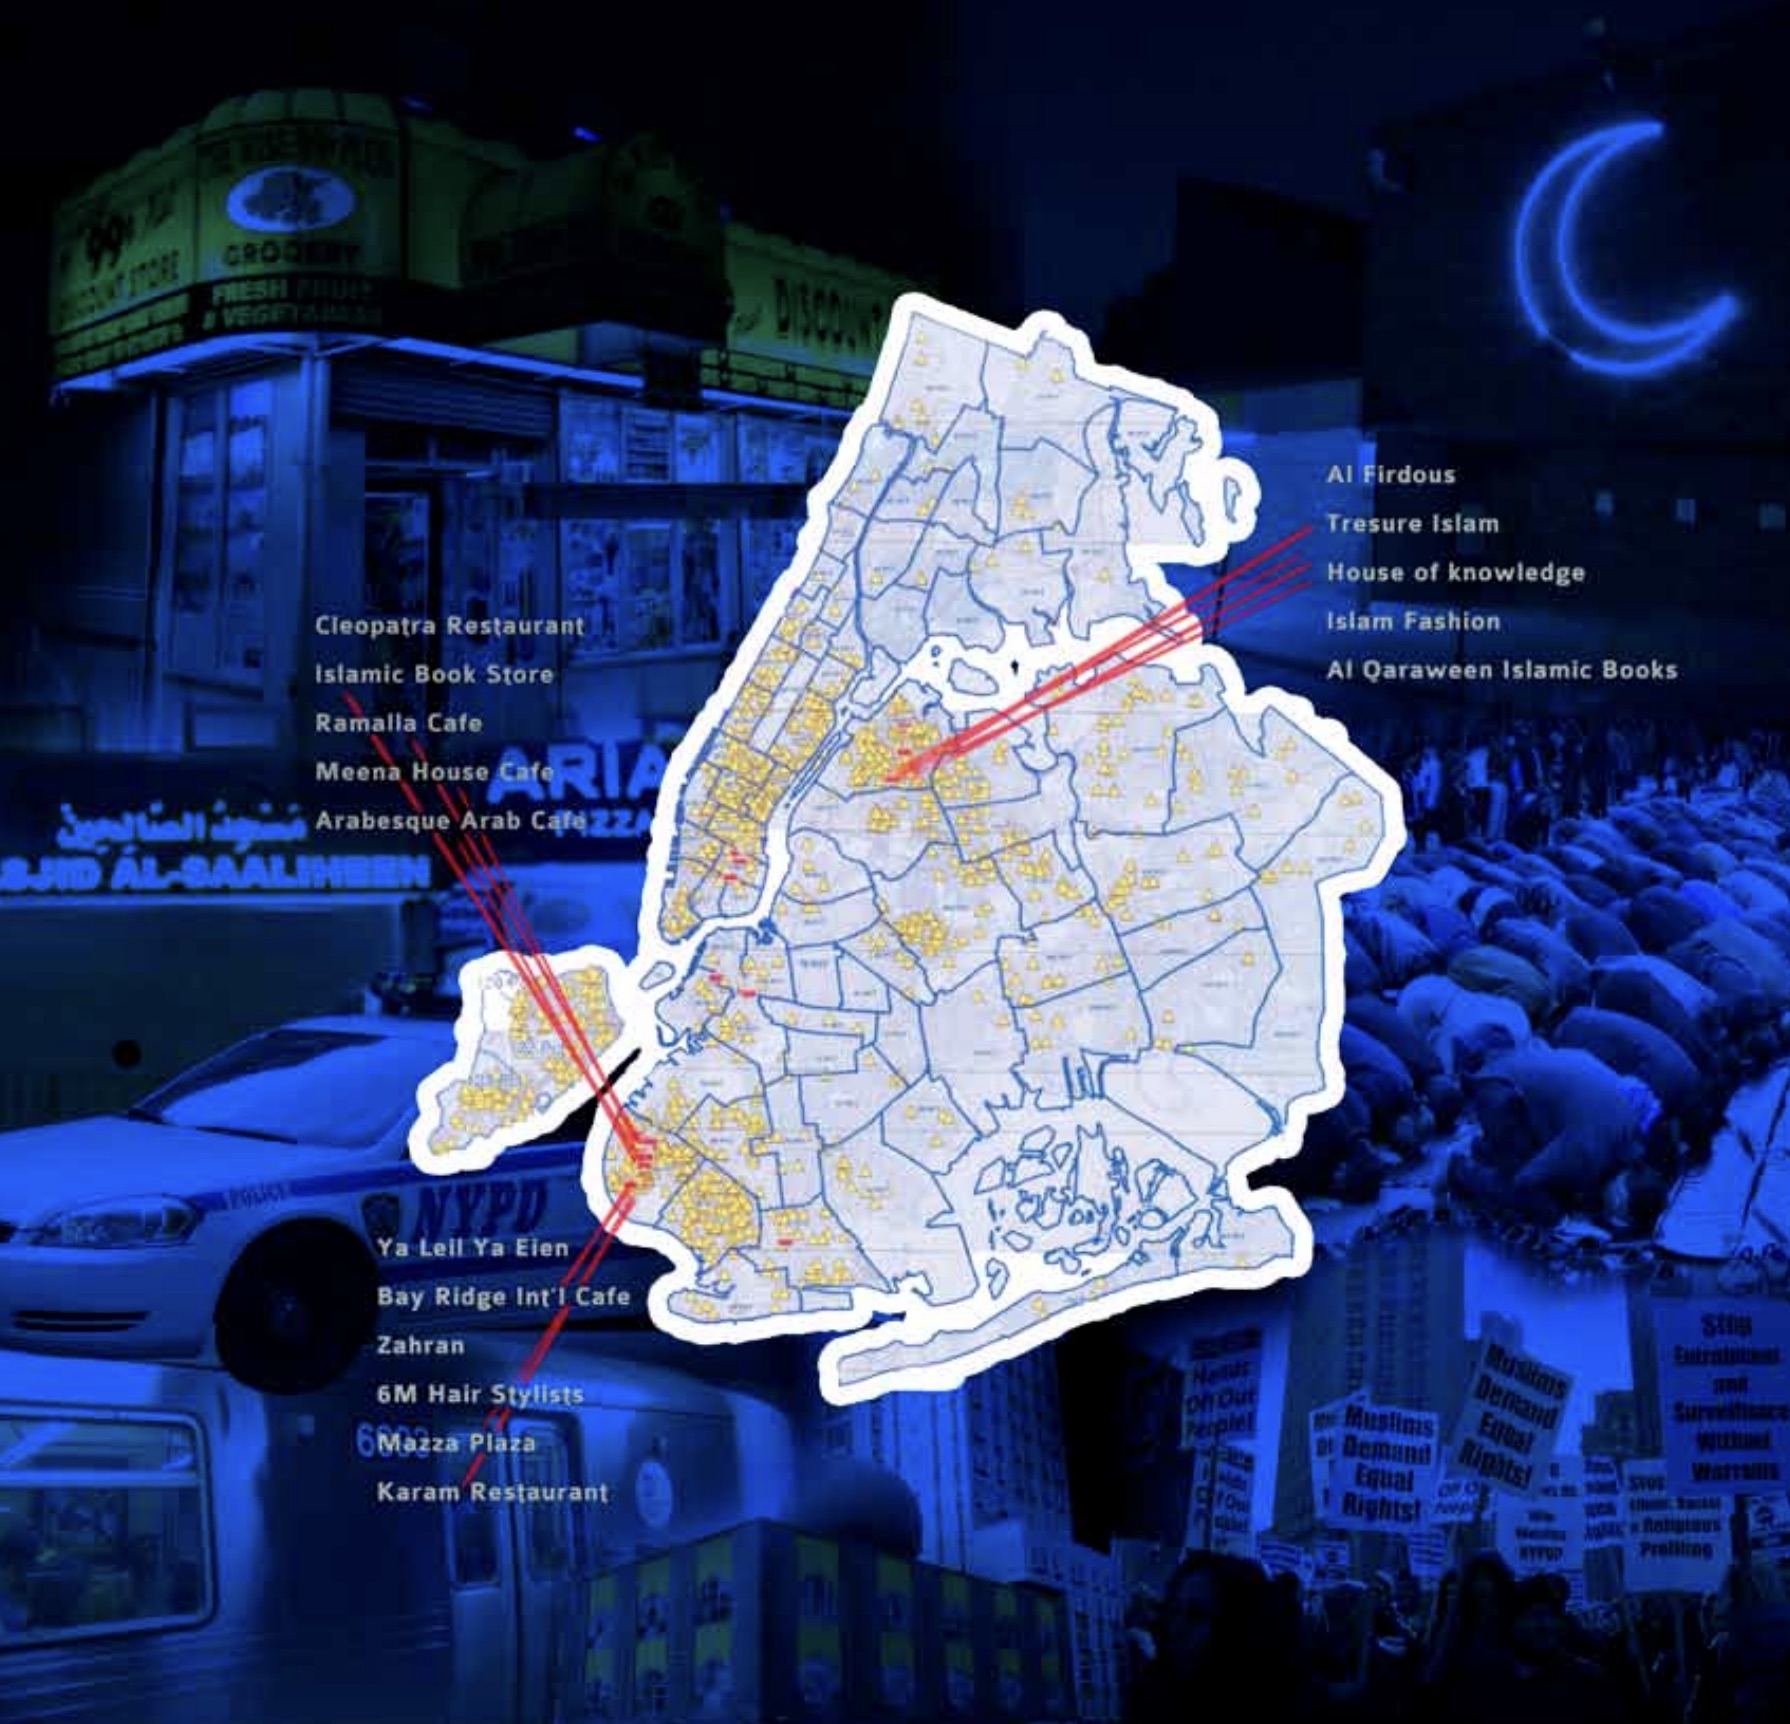
That geography fell primarily to the purview of the Demographics Unit, which employed a mix of street-level surveillance and undercover work with mapping and analysis of publicly available data. Documents of the Intelligence Division’s activities, leaked to the Associated Press reporters Adam Goldman and Matt Apuzzo in 2012, describe the Demographics Unit as a 16-member team focused on “[identifying and mapping] ethnic residential concentrations within the Tri-State area.”
Among the documents released by the AP are a series of Demographics Unit reports on various ethnic enclaves (described as “Locations of Concern”) and potential terrorist hangout spots (e.g., internet cafés). Each report begins with a high-level statement about its subject matter and a five-borough map of the various locations (mostly businesses) further detailed in the report. The various “locations of concern” are presented in tables with a photograph of each location, its address, and a brief banal description: “a medium-sized Arab restaurant owned by a male Syrian”; “a sign in Arabic regarding Arabic newspapers observed at the location.”
Much like the sloppy statistics undergirding CompStat’s veneer of accountable and exacting data collection, the Demographics Unit documents undermine the rhetoric of a capable Intelligence Division stopping terrorism in its tracks. The report on “Syrian Locations of Concern” includes an entire paragraph copied-and-pasted from “Pakistani Locations of Concern” without bothering to replace “Pakistan” with “Syria.” Summaries of restaurants and delis in Bay Ridge and Kensington are riddled with inaccuracies that, to some of its targets, amounted to insult atop injury — it’s bad enough to arbitrarily declare a Lebanese-owned market a “location of concern” simply because of its staff and clientele, but why add the indignity of mistaking its owners for Syrians? And how, if at all, did these inventories of neighborhood spaces and student groups help prevent terrorism? (As Goldman and Apuzzo further documented in their reporting, they didn’t.)
Once again, if the Demographics Unit was notable, it was not entirely unique to New York. In 2007 Bill Bratton, by now at the LAPD, proposed mapping Muslim communities in Los Angeles with a far more expansive effort than New York’s. Outcry from the Muslim community there ultimately stopped this effort. The NYPD Demographics Unit was disbanded in 2014 and lawsuits brought against it were settled out of court.
In contrast to the relatively low-tech Demographics Unit’s plainclothes surveillance, the other major mapping effort of the post-9/11 NYPD was defined by high-tech networked surveillance infrastructure, first around the area directly impacted by 9/11, then throughout the entire city. Rather than centering disorder on neighborhoods or intersections of low-level offenses, this camera-and-sensor driven remapping of the city produced an anticipatory geography, a map of a city where any area — rich or poor, residential or commercial, Muslim or non-Muslim — could be subject to terrorism.
This infrastructure was, some argued, well overdue: Although Bratton’s NYPD had made breakthroughs with technology, the period between his departure and 9/11 was one of stasis. After 9/11, Commissioner Ray Kelly assembled a committee of experts from IBM, Merrill Lynch, and Deloitte to bring the department into the 21st century.
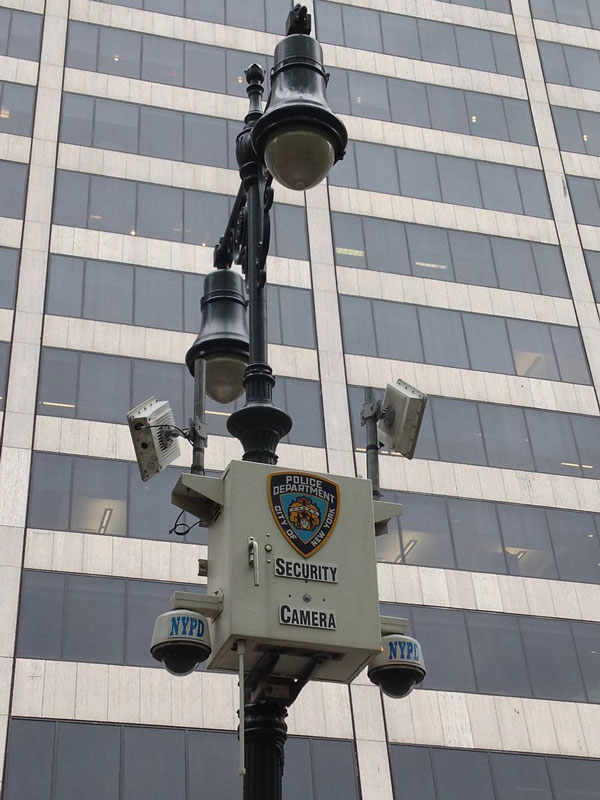
Initially built out as the Lower Manhattan Security Initiative (LMSI) in 2005, the public-private partnership network of surveillance cameras drew $10 million from DHS and $15 million from the city, and expanded over the next seven years to become the Domain Awareness System (DAS). Created in partnership with Microsoft, the DAS is described as “a central platform used to aggregate data from internal and external closed-circuit television cameras (CCTV), license plate readers (LPRs), and environmental sensors, as well as 911 calls and other NYPD databases.” An array of military-grade surveillance technologies like Stingrays (technology for capturing cell phone data), Shotspotters (acoustic sensors that are supposed to monitor for gunshots), and backscatter vans (mobile x-ray units for searching vehicles) have been added to the NYPD’s investigation arsenal. Slightly less high-tech surveillance techniques are no less disconcerting. Today NYPD gang units collect and monitor teenagers’ social media to identify criminal conspiracy via Facebook connections, most notoriously in a major dragnet operation in Harlem in 2014.
Unlike the ancient CompStat database jury-rigged from off-the-shelf software, today’s departments have access to an array of vendors tailoring tools to law enforcement needs. Industry giants like IBM and Microsoft recognize a market niche, while specialized companies like ShotSpotter and VIEVU body camera vendor Safariland Group have expanded to meet a growing market, subsidized with federal grants. Companies large and small burnish their reputations by perpetuating the ex-police-turned-consultant industrial complex: Hiring distinguished former officers to sit on corporate boards or provide professional insight promises both expertise and access to professional networks. (Prior to his return to the NYPD in 2013, Bratton served on the boards of ShotSpotter and Motorola Solutions — the former receiving a $1.5 million contract from the NYPD in 2015; the latter a long-time vendor to the department.)
These new technologies and public-private partnerships might be an inevitable extension of the model first outlined on a bar napkin by Jack Maple over 20 years ago (which, on further reflection, sounds like advice for a sales team as much as a police department). As daily life has become more networked and reliant on networked infrastructure, crime mapping and data-driven policing have similarly expanded their frame to a networked vision of the city. The flat acetate maps have been replaced with real-time monitoring, mobile surveillance, wall-to-wall screens, personal histories collated from social media, and license plate readers. The core mechanisms of data collection and mapping remain, but the speed of that data collection and the rapid collating of that data with the historical record produces a map (in theory) of greater complexity for more informed decision-making. And, maybe inevitably, as the speed of data collection increased, both law enforcement and would-be vendors began to seek a shift from real-time to future tense policing — that is, trying to forecast crime before it happens.
When Jack Maple first began his obsessive analog data collection methods working for the New York City Transit Police in the 1980s, he was said to have referred to his outputs as “Charts of the Future.” Emphasizing the future — using historical data to prevent crime and maintain order, rather than react to disorder as it came up — was central to much of CompStat and broken windows policing’s ideology and appeal. That preventive, pre-emptive mindset worked well with a post-9/11 “never again” attitude, which justified surveillance on Muslim neighborhoods and the exponential expansion of camera networks.
Predictive policing — which, like CompStat, is less a meaningful technical term and more of a strategic positioning of data-driven management — emerged from a convergence of technical innovations in both counterterrorism and corporate logistics. While some of the academic research and development for what would become predictive policing began with funding from the Army Research Lab, its advocates in law enforcement compared the technology’s efficiency gains to innovations in Walmart and Amazon’s warehouse distribution systems. Simultaneously, an infusion of $2 million from the National Institute of Justice supported police departments across the country partnering with academics (and future police software vendors) to experiment with using historical crime and arrest data to determine both where crimes might be statistically more or less likely to occur again and who among previously arrested individuals might be most likely to commit crime again.
Modeling individuals’ risk drew more public scrutiny given the obvious sensational Minority Report implications, and correspondence between past racist policing strategies and a predictive model that ascribed a higher risk of gun violence to the same racially profiled individuals. New forecasting models and alleged algorithmic sophistication can’t mitigate the flaws of historical crime and policing data that mostly reflects a history of racial profiling and beat cops trying to fulfill quotas. And in the case of the aforementioned Army Research Lab-funded research that would become geographically-determined predictive policing software vendor PredPol, modeling techniques weren’t even designed with law enforcement in mind — the underlying math was based on models for predicting earthquake aftershocks and was tested initially to forecast casualty rates and insurgent activities in war zones. Predictive policing foregrounds triage over understanding or addressing longer-term, systemic damages — akin to, say, mapping potential earthquake aftershocks while ignoring the fracking wells that destabilized the geology to begin with. And grid maps of possible sites of future crimes can be easily used to reinforce broken windows’ old spatial model, mapping disorder away from systemic racism and economic violence and onto intersections of neighborhoods with under-funded schools or disintegrating social services.
In addition to the similarities in rhetoric, technical improvisation, and funding, predictive policing and CompStat share personal connections. Between their consulting careers, Bratton and Timoney both influenced the evolution of predictive policing. PredPol, the primary vendor of predictive policing software on the market today, emerged out of a partnership between UCLA researchers and officers working under Bill Bratton during his time as chief of the LAPD. Timoney’s influence was slightly more removed: Upon taking over as Chief of the Philadelphia Police Department, Timoney threw support and resources behind a small skunk-works initiative to create mapping software for the department. The project’s architects, two recent graduates from the University of Pennsylvania’s landscape architecture program, would go on years later to create HunchLab, a predictive policing platform that’s been used by police departments in Chicago, Greensboro, and St. Louis County. (Upon returning to the NYPD in 2013, Bratton championed predictive policing and selected HunchLab for a pilot program in 2015.)
These overlaps are not inherently conspiratorial or even purely causal. But they do demonstrate how many actors profit from the success of ever-more pervasive and ever-more trusted data-driven systems in law enforcement. The limitations of evaluating these tools based on their accuracy or effectiveness also become clear. Whether or not they “work” is as impossible to measure as any other variable deemed to influence the crime rate. A more significant question is for whom these tools actually work — who benefits from their success and who needs them to be taken seriously.
Sometimes, instead of justifying policing methods, maps undermine them. In 2013, maps studying the frequency and demographics of NYPD stop-and-frisk incidents were one piece of the much larger undoing of this central tactic of broken windows policing. The obviously disproportionate stopping of Black and Latino New Yorkers, a reality long understood by those residents and activists, was suddenly a numerically undeniable truth.
But this data was only made available to the public through court order. The NYPD is generally reticent to disclose any of the data it insists on collecting in the service of public safety. At a June 2017 City Council hearing about the Police Oversight of Surveillance Technology (POST) Act, which proposed increased public disclosure of NYPD surveillance techniques, representatives from the NYPD expressed defensive frustration at the implication that the NYPD lacked transparency or had any reason to be deemed suspicious for its application of surveillance technologies. Gleaning information about the data and technology-driven methods the NYPD prides itself on from the NYPD (be it through FOIL requests, court orders, or legislation) typically resembles pulling teeth, if teeth had lots of lawyers and a monopoly on state violence.
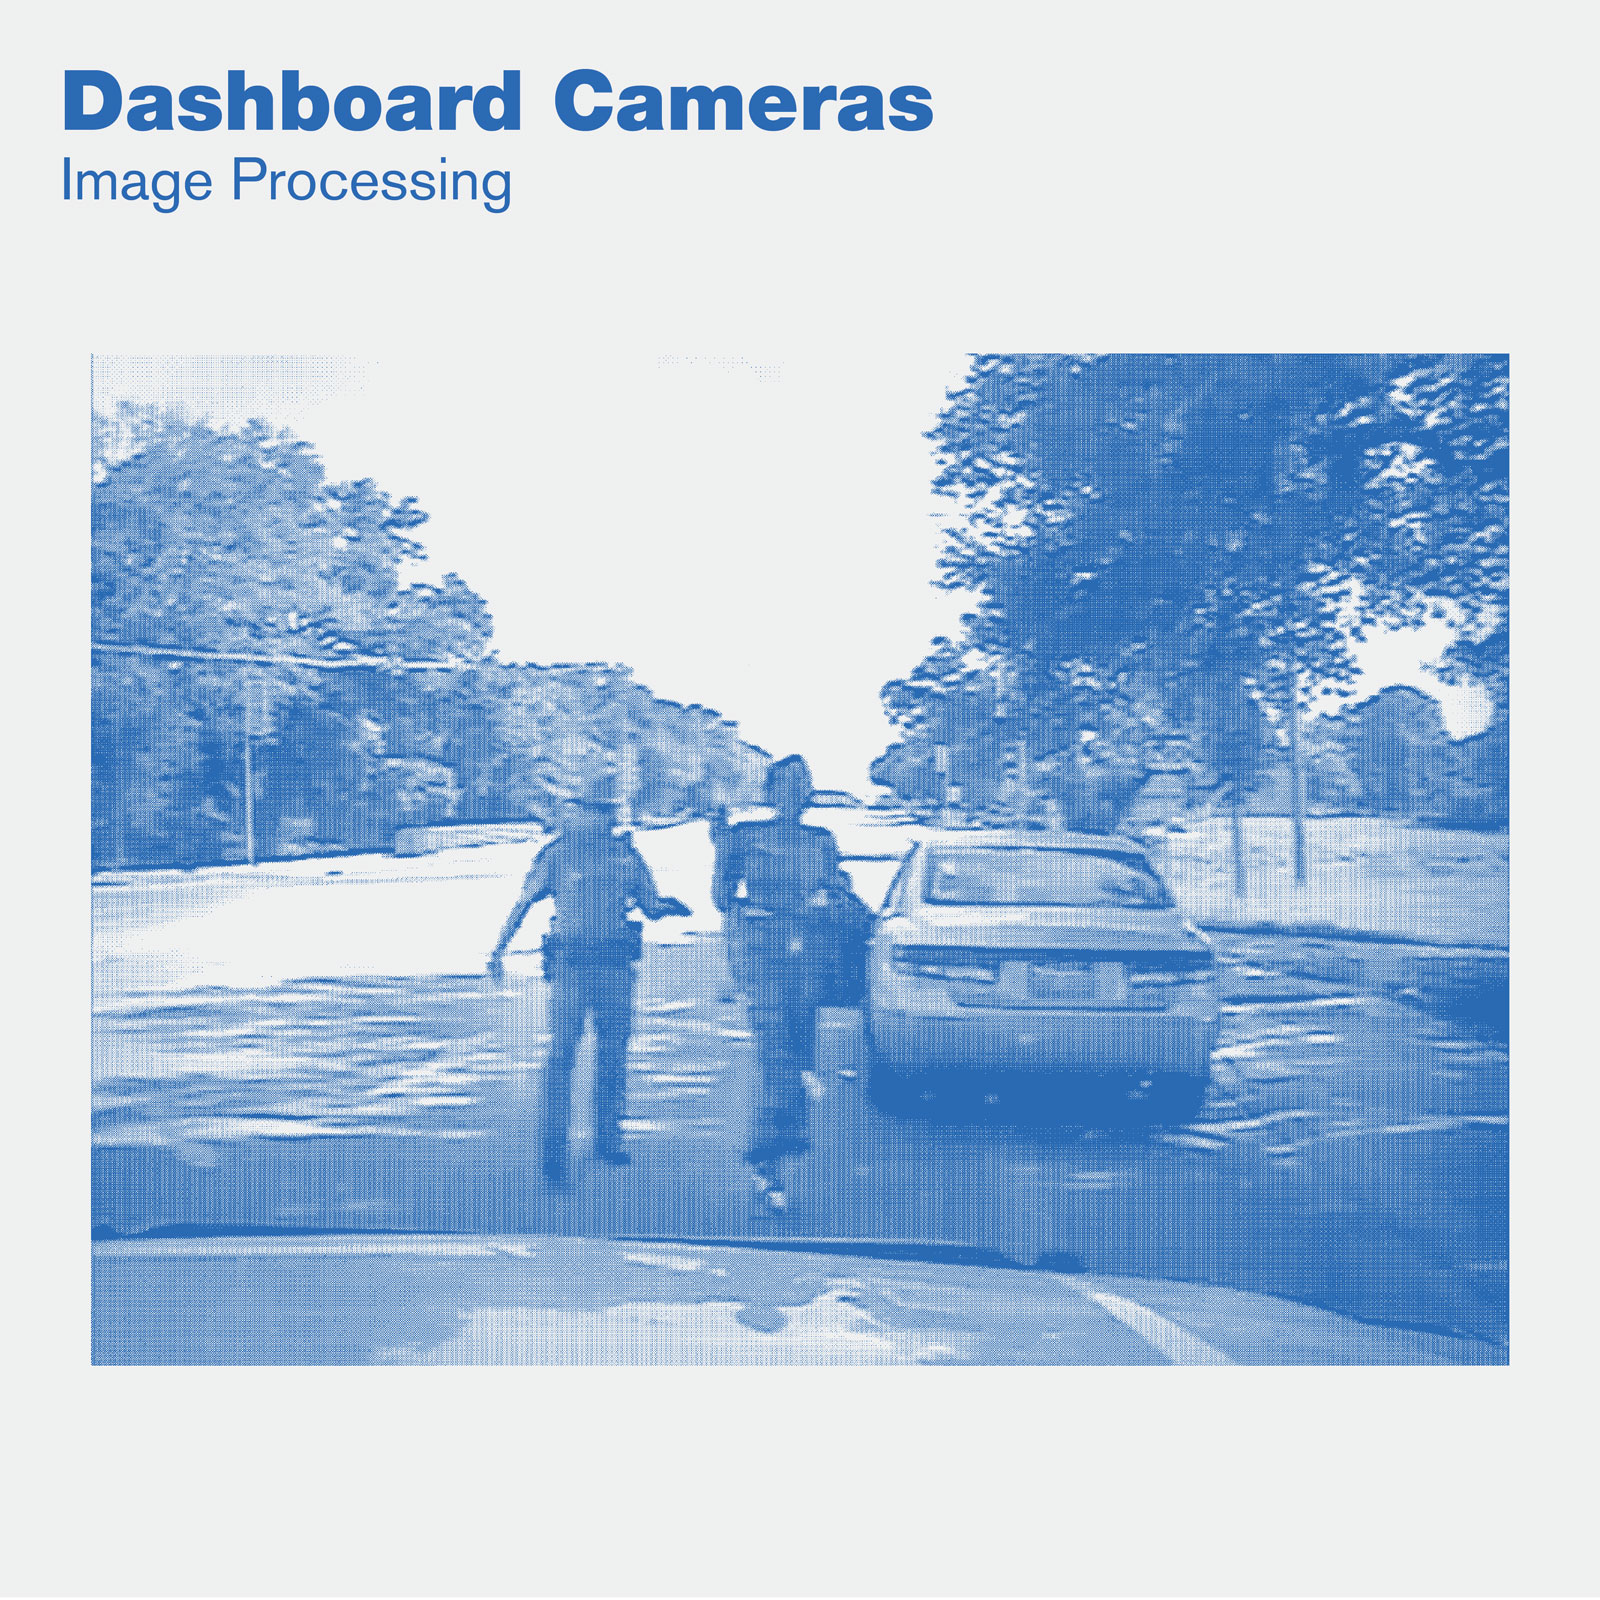
Police-worn body cameras, another recent transformative policing technology ostensibly serving public accountability, aren’t that easy to hold publicly accountable. Variations of cameras on and for cops have existed at least since the advent of the dashboard camera in 1990, but the tipping point for widespread adoption of body-worn cameras was in 2014, when the Obama administration requested $263 million to support body camera pilot programs across the country. The initiative followed several highly-publicized and sometimes video-documented murders of unarmed black men by police throughout the country, including Staten Island resident Eric Garner at the hands of NYPD officer Daniel Pantaleo. Although some of the outrage at the lack of accountability for police officers in these incidents was because the deaths had been captured on video and officers still walked free, body cameras were still heralded as transformative tools for keeping police accountable.
But the question of to whom police should be accountable — a public, their supervisors, or the state — remains ambiguous. While cameras are framed as tools for keeping police accountable to citizens by recording their actions, camera vendors’ marketing materials for police departments emphasize the value of cameras as a tool for preventing slander and holding the public accountable for their actions with police. As of November 2017, a survey of body camera policies conducted by Upturn and The Leadership Conference reported that over a third of major city police departments’ policies don’t make camera footage easily publicly accessible and only five percent had explicit policies to allow individuals filing police misconduct complaints to view relevant footage.
Body cameras also provide another data source to add to an ever-expanding map. Much like GIS technology transformed crime mapping by increasing the speed with which police departments could “see” crime patterns and combine or contextualize datasets, the threading together of other technologies (GPS, wireless communications, computer vision) and data management platforms created by body camera vendors transforms hours of archived footage that might otherwise go unwatched into indexed, geolocated, searchable evidence. The 2017 survey found only one major city police department (Baltimore) had a body camera policy with explicit limitations on using biometric technologies such as facial recognition on camera footage. Companies like police technology vendor Axon (formerly Taser) are enthusiastically pursuing the addition of biometric and analytics tools to their body camera products.
Metaphorically, the expanding temporal and networked dimensionality of today’s policing maps — which, at this point, might not even be called crime mapping so much as world building — has more in common with three-dimensional spatial modeling than flat 2D vector maps. The points of hotspot policing have been replaced with point clouds. In the ideal vision of the NYPD’s expansive, cutting-edge data-driven methodology, these historical, dense topographies of public and private data would accumulate into a legible terrain, one utterly absent of disorder. However, like most actual point cloud data produced with 3D scanning or lidar technologies, these maps are usually filled with “noise,” glitchy and inaccurate data that requires human evaluation and editing. They are yet more maps only as reliable as their interpreters.
Policing and urban planning have a lot in common. Their models often redesign the cities they claim to reflect, often on a biased premise of best interest. Recalling Bratton’s 1994 comments to a New York Times reporter describing the public as his “customers” and “reduced crime, reduced fear” as his sought “profit” from the corporate strategies of CompStat meetings, one other characteristic planning and policing share is a tendency to be misunderstood as customer service models. The “customers” are also less and less the actual public, and more and more private sector actors who benefit from the worldview mapped onto the crime map. Broken windows’ remapping of crisis away from diminishing social services and onto an impoverished neighborhood makes a ton of sense if your “customer” isn’t the neighborhood teenagers who now fear being hassled and criminalized over a minor offense, but rather real estate brokers who’d like to raise rents or make a poor neighborhood an “up and coming” one. Investment in pervasive surveillance systems and buzzword-inflected technologies that might be vaporware makes a ton of sense if your customer isn’t a Yemeni bodega owner, but rather a huge Wall Street bank anxious about keeping its employees safe from terrorism (or, in 2011, safe from Occupy Wall Street drum circles).
For almost 25 years, the model of the world constructed in NYPD cartographies has been replicated across the country, restructuring police departments and public narratives of order, justice, and the role so-called neutral technologies can play in maintaining both. There are many more beneficiaries of the world map constructed by law enforcement than vendors, consultants, and prestige-seeking upper management alone — they just played the biggest role in constructing it. To construct a counter-map of data-driven spatialized policing regimes — and, in so doing, lay a groundwork for modeling a different vision of justice or public accountability — requires teasing out that history, its players and its power dynamics, the institutional glitches in the map, and the cartographers who smooth them out.
The views expressed here are those of the authors only and do not reflect the position of The Architectural League of New York.
An examination of the pervasive and often overlooked infrastructure of criminal justice in New York and the spaces that could serve a more just city.
In This Series