


Series
Profiles in Public Service
Conversations with public servants illuminate the complex workings of city government and how local agencies shape the physical and lived experience of the city.
We are celebrating 15 years — and counting — of stories that are deeply researched and deeply felt, that build a historical record of what the city has been.
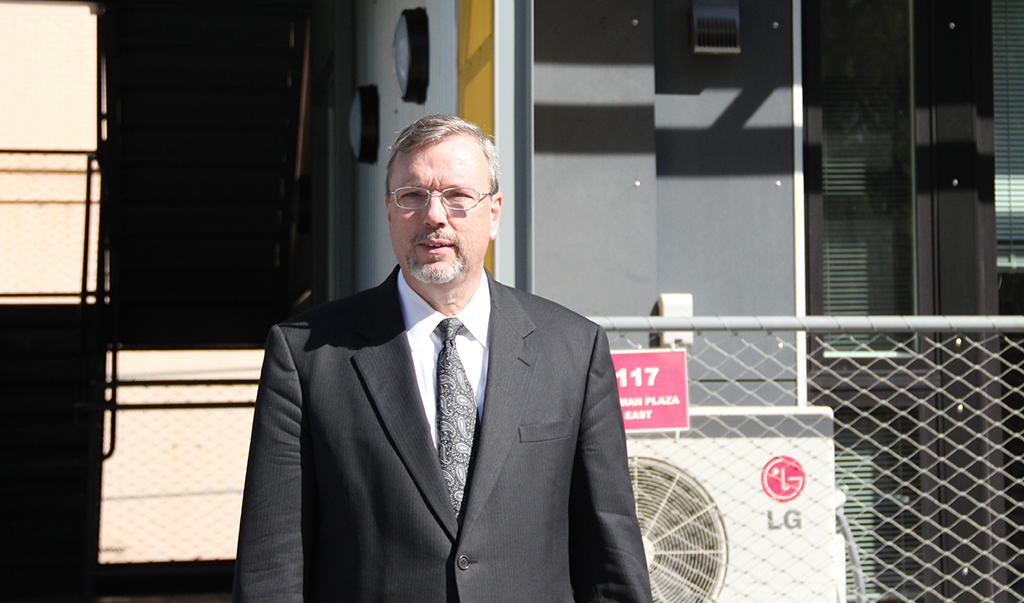
Of all the roles of government, emergency response may be the least controversial. When disaster hits, we expect our fire, police, and other public services to provide immediate relief. But as James McConnell, Assistant Commissioner for Strategic Data at the New York City Office of Emergency Management (OEM), reminds us, tactical effectiveness in a crisis requires more than boots on the ground, ready at a moment’s notice. It requires long-term planning supported by accurate information and nimble implementation that is adaptable to each situation.
As the official in charge of compiling and presenting data for the City’s emergency management arm, McConnell has a deep knowledge of the growing impact of geo-located information on city operations. In this installment of our series of Profiles in Public Service, McConnell dissects the process by which this data goes from table to action, an emergency housing prototype tailored to urban areas, and the evolution of the field of emergency management. –J.T.
What do you do?
I’m the Assistant Commissioner for Strategic Data here at the New York City Office of Emergency Management (OEM), and I’m the director of our Geographic Information Systems (GIS) Division. One of OEM’s main missions is to provide situational awareness to decision makers in the city during emergencies. We have over 40 emergency plans, and in the case of an emergency, OEM is where the response coordination effort between different agencies comes together.
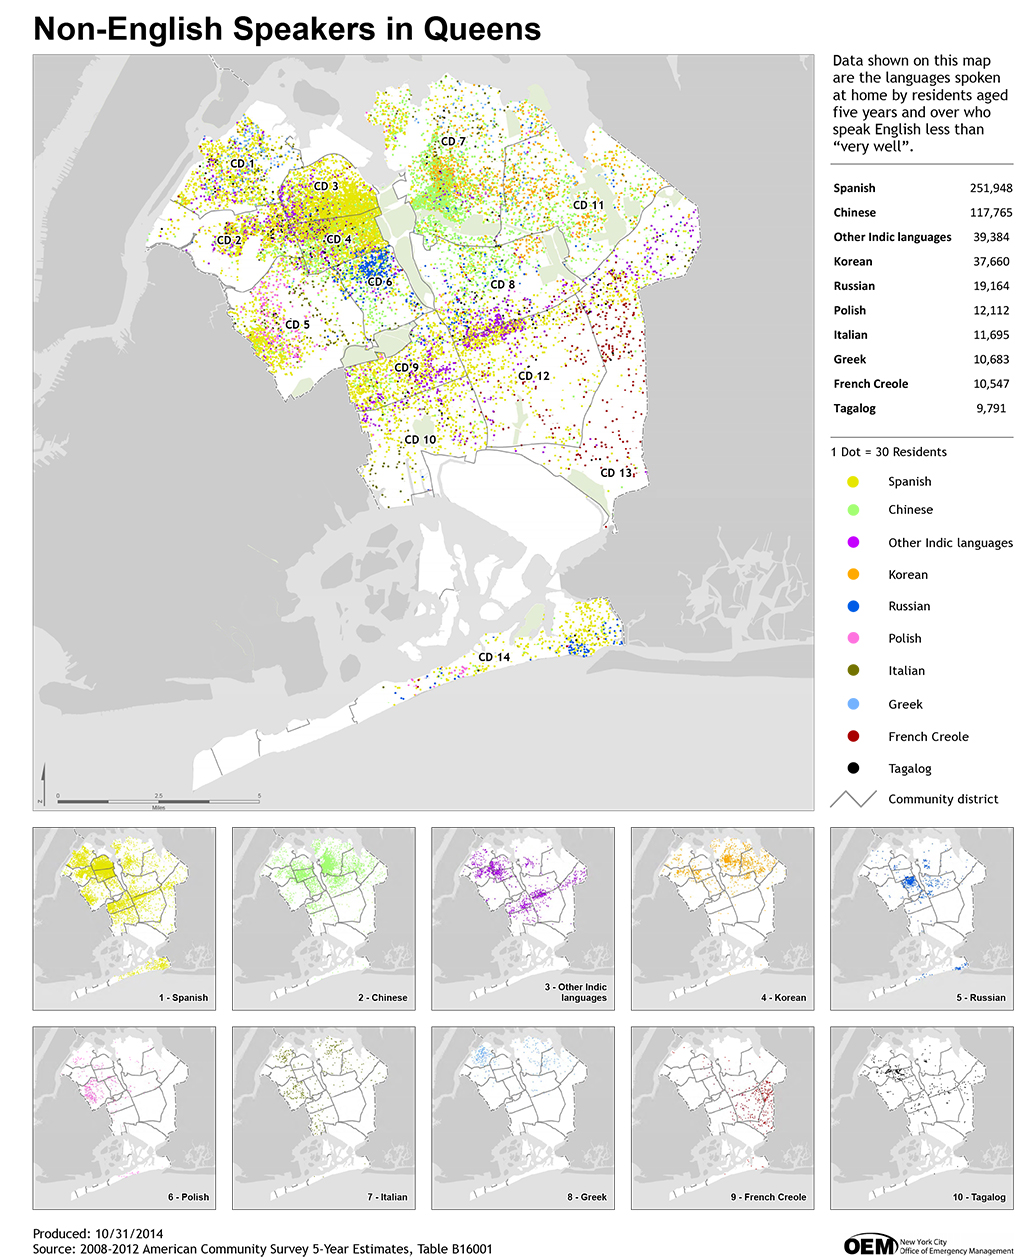
GIS data is just a series of data sets that have at least one way of relating information to a location on the Earth — that’s usually an address, but it could be an x, y coordinate or a polygon that describes a park. My staff maintains a catalog of about 1,000 layers of up-to-date, geo-referenced data about the city’s facilities, infrastructure, and population in order to provide reliable information to decision makers responsible for emergency plans and responses. During emergencies, we incorporate data we get from responders in the field with our existing base data. Virtually all data that’s actionable has an associated location; it happens somewhere.
What you were up to before you came to OEM?
After getting my graduate degree in planning, I worked first for a private consulting firm, then for the Regional Plan Association on their year-long Westchester 2000 project. Then I started at the Department of City Planning, where I worked for 16 years before OEM, first as a Bronx borough planner, then as a citywide waterfront and open space planner. I also developed a technical manual to guide community groups developing 197-A, or community-based, plans and helped implement one such plan for Chelsea.
How has GIS’s role in city government changed over your tenure?
When I started at the Department of City Planning, there was no GIS available, and even when it was introduced in the mid-‘90s, it took some time before people realized how useful a tool it is. Instead of maps acting merely as a graphic at the end of a report, you can use GIS in every step of your analysis to try different scenarios. I became pretty good at it and was at one point training other city planners on how to use it. I initially got involved at OEM because the agency was so small — it wasn’t its own agency but rather a part of the mayor’s office (we’re still a small agency, with about 180 employees) — that it didn’t have a GIS division, so I was detailed to them for some emergencies: the threatened 1999 transit strike, the West Nile Virus outbreak in 1999, and Y2K. OEM eventually wanted to start its own GIS division and offered me a job to move over here to set one up. I was supposed to start in October 2001. Then 9/11 happened, so unfortunately that’s my anniversary date at the agency.
Since it was first introduced, GIS has become much more pervasive in city government. The Department of Information Technology and Telecommunications has a whole division that supports the use of GIS in other agencies. There is still a range of capacities, but most agencies now have some level of GIS to assist in managing things. The Parks Department, for example, is really good at reporting data geographically. They have a system called Storm Mobile to report downed trees, but it’s really the same system that their forestry people use day to day to give attention to the trees that need care. After a storm they take that same system and ramp it up, incorporate information from 311 calls and field responders, and pass that data along to us so that we can immediately inform people in City Hall and compare it to other types of cleanup.
How does OEM tie into the workings of the rest of city government?
We’re not an operating agency like the NYPD or FDNY, but we look at hazards that the operating agencies must respond to. The goal is to think through a problem ahead of time and then work with other city agencies to develop plans that outline which agency will provide what expertise, equipment, and staff in the case of an incident. We then take that plan and test it through drills and tabletop exercises. During an event, we monitor whether people are fulfilling their roles or if they need more resources, and throughout we keep City Hall involved and up to date. Our commissioner is the person who briefs the mayor about the big picture during an emergency.
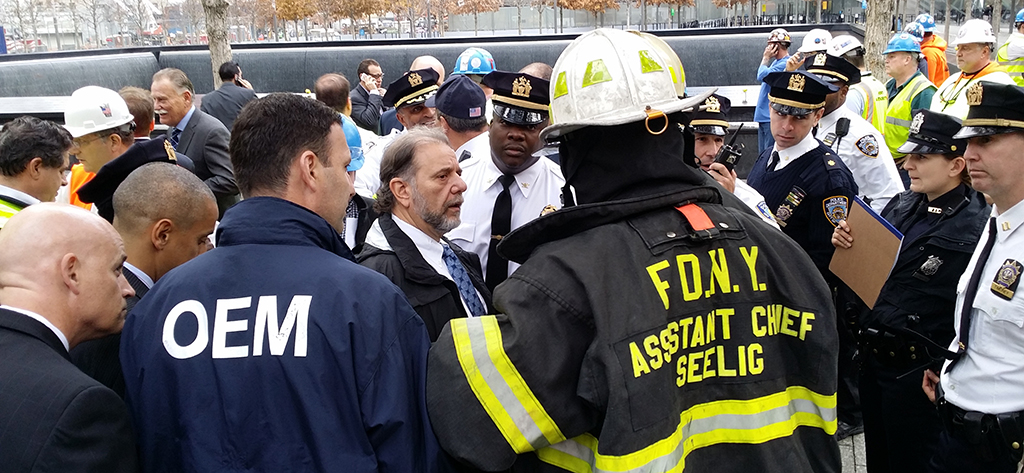
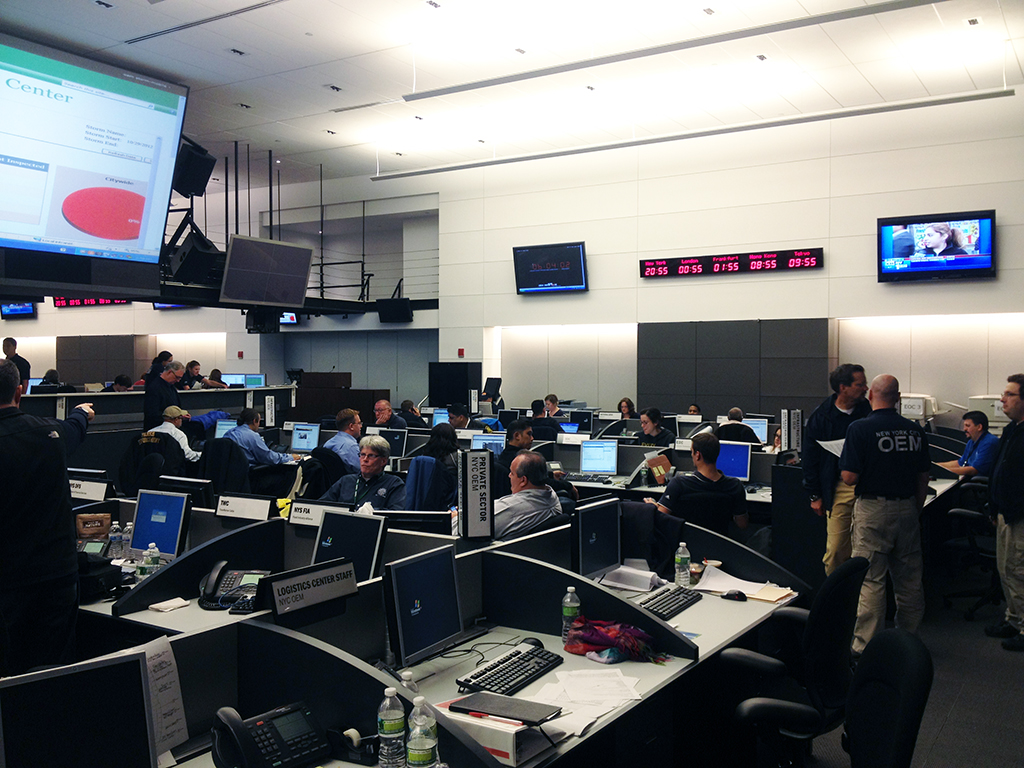
OEM staff members are not first responders or incident commanders, but we’re there to make sure that everybody’s talking to each other, people have the right information, and any requests for help are being circulated properly. We also have a 24-hour watch command that monitors police and radio reports and responders who act as on-site coordinators. If it’s a big enough incident with more than one agency involved, like a large fire where Con Edison has to turn the gas off and the Red Cross has to put people up for the night, we’ll send somebody to the site who will convene a conference right there on the street. If it’s larger than that, we open up the situation room, which consists of about twelve OEM people taking and making phone calls and e-mails to provide situational awareness. Before a major event with the potential to cause emergencies, say a winter storm, we’ll coordinate inter-agency phone calls, with dozens of representatives on the call, to make sure agencies are prepared to respond. If the event is big enough, we open up our Emergency Operations Center and can bring in up to 130 agencies from the city, state, and federal governments and the private sector. OEM becomes the place where the coordination happens.
The main imperative is to follow the plans we’ve developed. When an emergency hits is not necessarily the time to think up new ideas. You still have to be agile, to be able to adapt to the situation, and to shift resources to different areas or agencies that have greater needs depending on what you’re hearing, all of which requires good information and good data. Probably about 80% of all emergency responses are the same in terms of the basics: evacuating the affected area, setting up shelters, managing traffic, and facilitating transportation. But on top of that base, there are some actions specific to each plan. For example, our radiological plan has some different steps than our strategy for a coastal storm: with weather we usually have some heads up, but with terrorism or a major accident the point is that you don’t know when it’s going to happen.
No matter what the disaster, we’re supposed to coordinate the cleanup. There is never an exact end to an emergency, but we do have a “demobilization” point. For Sandy, which made landfall on October 29th, we had opened five days prior. We didn’t scale down to just our agency in the Emergency Operations Center until January 15th. Other than 9/11, Sandy was our longest mobilization ever, about 11 weeks. Before that the second longest was only 20 days, following the September 2010 tornado that swept through Staten Island, Brooklyn, and Queens.
Following an emergency, we compile after-action reports to learn more about what did and didn’t work well. We’re still implementing the last recommendations from Sandy. Between emergencies, we’re always rewriting and updating plans — that’s more of our day-to-day job.
Disasters generally draw on support and engagement from many levels of government, so how does that play out in OEM’s work?
We work very closely with the State’s Office of Emergency Management and the Federal Emergency Management Agency (FEMA), who are present in the Emergency Operations Center during activations. It’s a very good working relationship. New York City is unusual for FEMA: in many places they go, they manage the whole response. It was a learning experience during the Sandy response to figure out how not to duplicate work — we weren’t used to getting outside help, and FEMA wasn’t used to having a really strong local government doing a lot of what they would normally do.
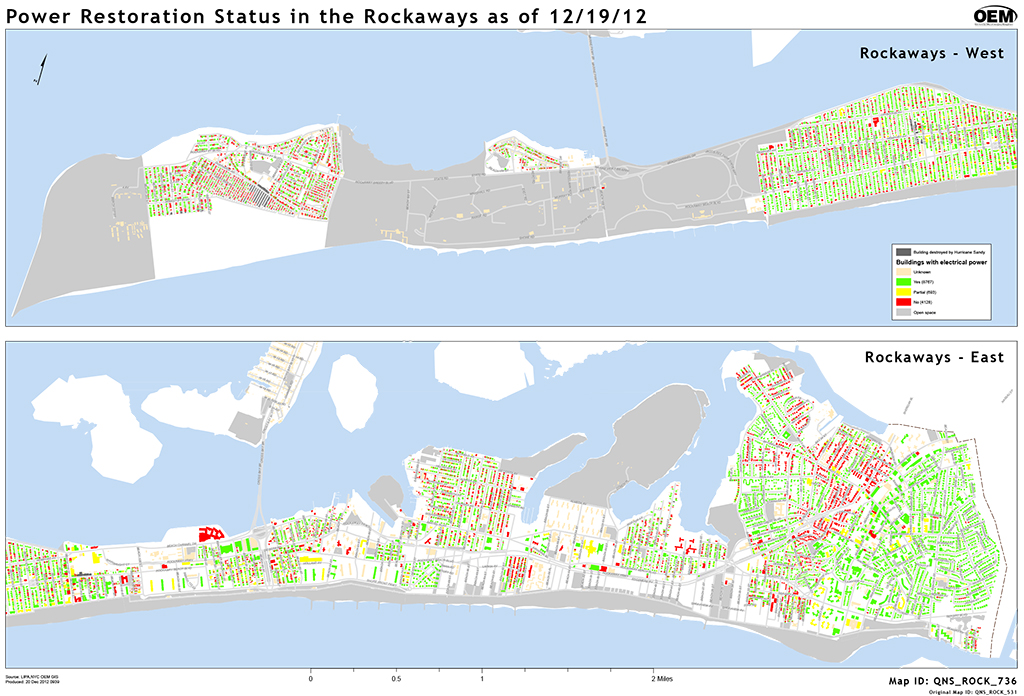
In terms of GIS, FEMA brought a big team. We gave them copies of all of our very reliable local data. They in turn came in with a lot of really good national data, and Sandy was the first time we could see and use it. There were a lot of federal agencies represented in the Emergency Operations Center, so we split the workload: they did maps and data for federal agencies; we did all the city agencies and voluntary associations that were asking for our help. In the first three weeks, we produced over 500 unique maps based on those requests by combining base data with the incident data coming in.
Tell me about all this data. How do you make it actionable?
We’re really voracious consumers of data, and our data catalog is probably the best in the city. We have the luxury of sitting down and spending time with new data sets, which most people can’t do. We may decide that it’s not useful at that moment, but that’s still time well spent. Most of our data is not specifically for emergency management, and we gather information that we aren’t certain will be useful in an emergency, but could be. We don’t have to know exactly how we are going to use it; we just know that it’s always better to have more.
There are also many data sets that are similar. If you’re looking for rail transportation, there are about five or six choices in our catalog, and we recommend different data sets for different uses. That’s partly what we do at our Data Development Center: help our partnering agencies — the NYPD, FDNY, Department of Health and Mental Hygiene, and Department of Environmental Protection — figure out what’s useful and what’s the most up-to-date. Sometimes we combine data sets so that they’re more useful together; for example, we’ll take building footprints and add USPS addresses. A tiny percentage of what we have is confidential. We have access to information about the water supply that we can’t share with anybody. And we have information about the subways that we can’t share except with the police and fire departments.
The type of data we use really depends on the plan and the situation. Across the board, we’re often looking at demographics — socioeconomic information or the number of households with individuals with disabilities — and we can draw robust information from the Census and the American Community Survey. We have lots of information about transportation and facilities like hospitals and schools, which are particularly crucial in emergencies. Schools are often our main asset for sheltering.
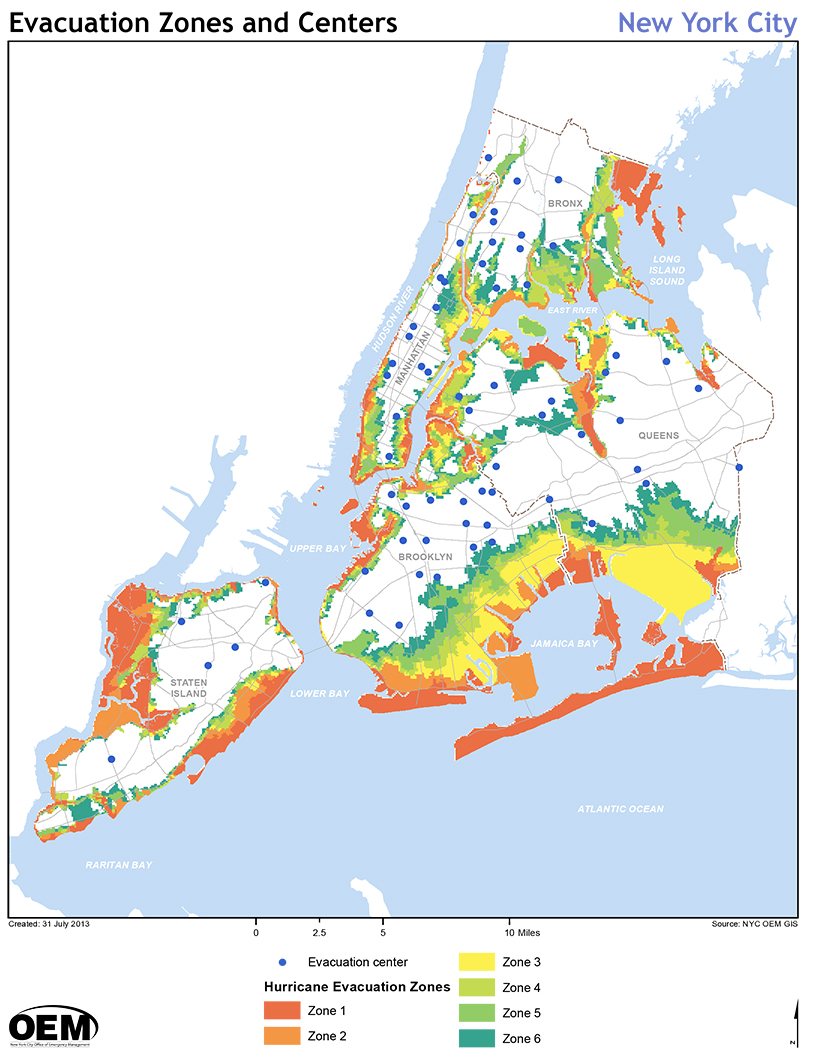
For our Coastal Storm Plan, we worked with a model developed by the National Oceanic and Atmospheric Administration called SLOSH — Sea, Lake, and Overland Surges from Hurricanes. Last year we used that information to expand our hurricane evacuation zones from three to six. My staff went block by block in the city to decide which zone was most appropriate for each area given what the model showed for the potential level of inundation from storm surge. The website where you can find your zone and nearest evacuation center is one of the few public facing things my division works on.
Are there any new projects or trends at OEM or in the field that you find particularly forward-looking?
We’re in our second phase of the development of a situational awareness dashboard project now, which will allow our planners in the Emergency Operations Center to pull up much of the data they need in map and table format right at their desktop.
I also ran a design competition for a temporary housing model that we think FEMA should consider for urban areas after a major storm. The prototype is sitting just across the street from our headquarters here in Brooklyn.
The idea behind the project is if we can keep people in or near their neighborhoods while their permanent housing is being rebuilt after a disaster, they will still have access to their family, friends, congregations, schools, and businesses. There might be a destroyed area of a few blocks along the shoreline, but often right upland the neighborhood is still functioning, so various services are still nearby. The experience in New Orleans after Katrina was that a lot of people who moved further afield never came back because they started new lives.
FEMA only has single-family models for temporary replacement housing — the Katrina trailer and a few more robust options. Because space is limited and we only have certain places where we could place such units in New York City, we were looking for a more urban model with increased density. I’m not talking 20 stories, but we think you can build up to four stories before you need an elevator or a complicated foundation, because, again, these are temporary.
We used the design competition and feedback from the housing industry community to develop the design specifications alongside our partners at the Department of Design and Construction. Then we built the prototype this April. The seven pieces were put together in 14 hours, though of course it took more time to hook up to water and electric. OEM employees are living in the prototype for short periods, and we’re working with NYU to analyze their experiences. I spent four nights there. It was fun, and the units are really quite spacious — the second floor is 800 square feet!
The main goal is to prove that you can have a very livable multi-family type of temporary housing. Our federal partners — including FEMA — have shown strong interest, but they don’t yet have approval to integrate it into their menu of options for a locality after a storm. Our prototype is more expensive per unit than the seven one-family options FEMA currently provides, mainly because the structure of each unit must be able to bear the weight of the units above it. To comply with the City’s building code, these are built as if they’re permanent. Even though they’re bolted together and they’ll be unbolted to be moved again, they could survive 50 years like a permanent building. We want to test taking the prototype apart and reconstructing it somewhere else to make the point that it is reusable. Then the cost/benefit ratio of our prototype starts looking like the one for a single-family unit that, like a lot of those deployed after Katrina, were never reused and were never meant to survive more than a couple of years. Ours could eventually be used in other parts of the country or even other parts of the world following future emergency events.
How have you seen the discipline of emergency management evolve and where do you think it’s headed?
The field is relatively new and is becoming more and more important. FEMA was only formed in 1971, and OEM in 1996. More and more, we are realizing that we have to have an organized way of responding to emergencies, and citizens now expect a good planning effort. Yes, a disaster is a disaster, but you can have good responses and terrible responses. Katrina was a terrible response. I think New York did pretty well with Sandy. Because of the expectations, I think that any locality or state has to have a robust emergency management team, so the field will continue to grow in importance and in the number of people involved in it.
It’s just good government — and our work extends beyond an emergency. Disaster response demonstrates a strong sense of what each agency does and what its strengths are, which is useful for normal operations as well. How an emergency is handled is a test for any government.
The views expressed here are those of the authors only and do not reflect the position of The Architectural League of New York.
Conversations with public servants illuminate the complex workings of city government and how local agencies shape the physical and lived experience of the city.