


Series
Profiles in Public Service
Conversations with public servants illuminate the complex workings of city government and how local agencies shape the physical and lived experience of the city.
We are celebrating 15 years — and counting — of stories that are deeply researched and deeply felt, that build a historical record of what the city has been.
In our commitment to highlight the choices that shape the urban environment, Urban Omnibus has consistently featured first-person accounts from individuals who work in local government. Lindsay Haddix, of the Department of Housing Preservation and Development, shared how the agency tailors its approach to distinct contexts and challenges. Dana Gumb, of the Department of Environment Protection, explained long-term efforts to engineer existing wetlands in Staten Island to compensate for the borough’s insufficient storm sewer system. Other examples include perspectives from a landscape architect with the New York State Department of Transportation, an architect with the Jersey City Housing Authority, the director of an arts program for the MTA, among others. And while the relationship between the built environment and the Departments of City Planning, Design and Construction, and Parks and Recreation may be obvious, many other local government agencies have a less recognized, but no less important, effect on the physical shape and lived experience of the city. In an effort to illuminate further the complexity of local government, and to showcase some individuals motivated to work in public service, today we launch a new series: Profiles in Public Service. Over the coming months, we will hear from people working on the design of schools, the collection of the city’s geographical data, and many more.
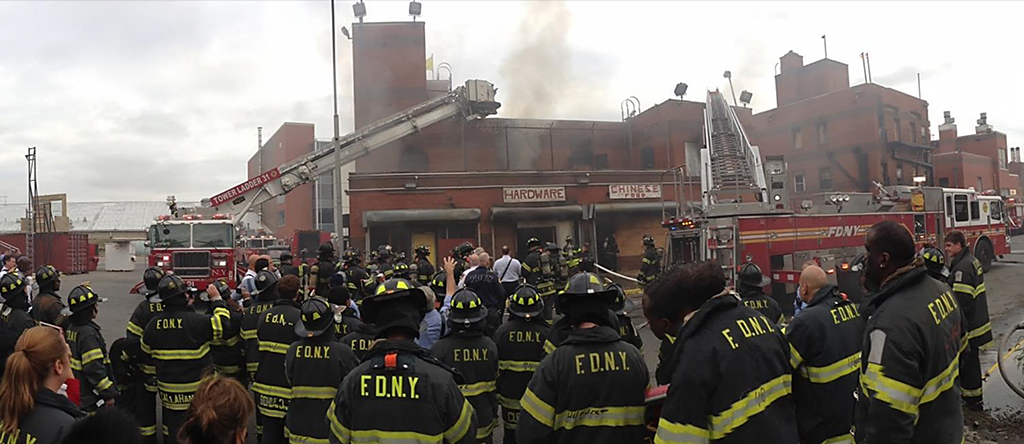
For the first installment in the series, we spoke with Jeffrey Roth, the Assistant Commissioner for Management Initiatives at the New York City Fire Department (FDNY) and an officer in the New York Army National Guard. At the FDNY, Roth has driven the implementation of a data-based approach to fire prevention, one of the first projects in the City that makes use of a more robust data sharing mechanism among agencies. Here, Roth explains the potential of effective data sharing and analysis to improve government stewardship of public resources and how his team is pushing the boundaries of analytics to inform the fire department’s operations, from defining fire inspection priorities to determining where the department should recruit to increase the force’s diversity. –J.T.
What does the Office of Management Initiatives at the FDNY do?
We’re an umbrella organization of sorts with four functional areas: internal audit and compliance, our new analytics unit, management reporting, and grant monitoring.
How do your education and prior professional experiences inform your work?
I studied public policy and urban planning at the Kennedy School of Government and the Graduate School of Design at Harvard, in addition to some military training programs. Each discipline fosters a different skill set. On the planning side, I learned how to think of information spatially: that if you take a data set and put it in a table, it tells you one thing, but if you map those data it can give you a whole different perspective. I see that as a key skill that ought to be more prominent in the policy world. My military training taught me how to lead teams and people, create processes and systems for managing conflicts, and how to run an organization in an austere environment.
In policy school, I learned how to ask critical questions and ensure that a set of recommendations was arrived at through a critical thought process. Like many people studying government, I hoped to work in the federal government on macro level policy. I then spent a summer in Haverhill, Massachusetts – a small city of 60,000 north of Boston – working for Mayor Fiorentini on projects related to downtown redevelopment. I learned important lessons there about how to bring multiple stakeholders and multiple government entities to the table. I think I’ve found ways to use these skills in my current position where I’ve been able to use data to drive decision-making and inform policy.
What led you into public service?
I grew up outside of Detroit in a small, rural town. When I was in high school, I tutored kids in inner city Detroit. And Detroit is a heavily segregated city, both racially and in terms of income inequality. Spending substantial amounts of time there, I began to understand how the built environment can contribute to segregation.
I come from a family with a history of military service. When I was in high school, I had an older brother that died in the US Army. That had a profound impact on my life and my understanding of service. I saw how the military as an organization takes very good care of its people even in tragic circumstances. So, all of those things started to build my interest in service, policy, and working in the public realm.
I also spent a couple summers in Romania after the collapse of the Soviet Union working with orphans and disadvantaged youth. I came to learn that the major orphan problem was directly related to the policies of the dictator Nicolae Ceausescu. He wanted to create the world’s largest work force, so he banned contraception and taxed families if they didn’t have a certain number of kids. As a consequence, many kids were abandoned because families couldn’t afford them. Getting to know those kids as individuals, I started to make the link between macro policy and its effect on real people. I began thinking about the complexity and impacts of the policy, how to measure those impacts, and how to make policy that actually makes people’s lives better rather than worse. That’s really where it started to churn that this was an area of interest to me.
How did you come to work at the FDNY?
I interviewed for a position at the New York City Mayor’s Office of Operations when I was finishing my graduate program, and I talked about my experience in Haverhill bringing everyone to the table to reignite a stalled project. They explained that coordinating people across different agencies was also what they did. So I took the job and began working on a number of interagency projects. One of those was the Construction, Demolition, and Abatement (CDA) project that came about as a result of the fire at the Deutsche Bank building in 2007 where two firefighters were killed. We wanted to know why the Fire Department wasn’t aware of all the different things going on with the building when they arrived to fight they fire. There was a lack of data and information sharing between city agencies that could have helped prevent those deaths. As a result, I got to know people at the FDNY really well, and that eventually led to a position here.
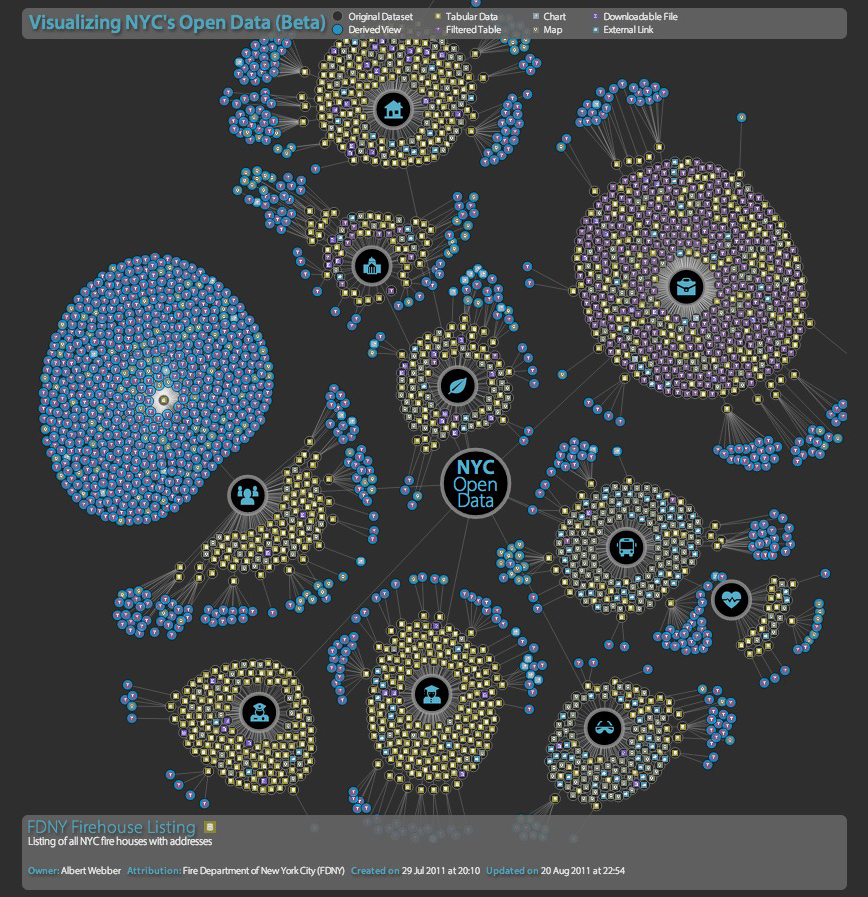
That project spurred City Hall to initiate the Data Elements Exchange Program (DEEP), which essentially created a data bridge between city agencies and a central repository for all agency data. So every participating city agency dumps their data into this repository on a regular basis. We can use that repository to source data that might be useful for our projects. What’s unique about the fire department is that we’re one of the first City agencies, if not the first, to consume these data in an operational way. We are sending field units out to actually do work based on the data we’re sourcing.
Tell us about FireCast and how it fits into the FDNY’s operations.
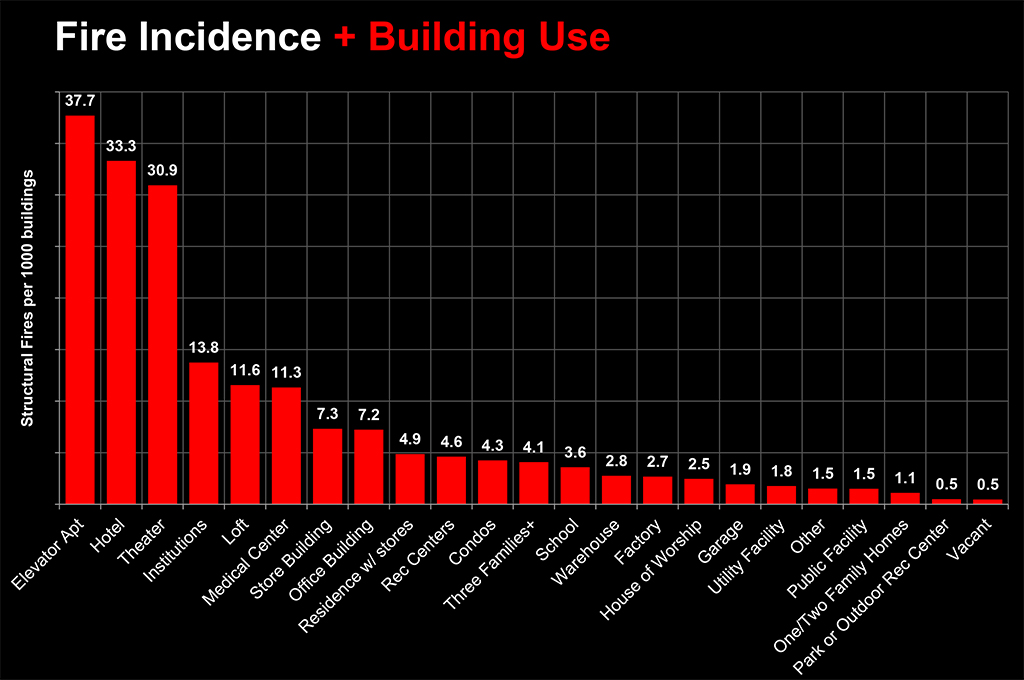
There are a million buildings in New York City, and the FDNY is responsible for inspecting 330,000 of those: anything that’s not a single or two-family home. Every one of the FDNY’s fire companies is required to do nine hours of building inspection per week, but emergency response can cut into that time. So each year, we inspect roughly 10% of those 330,000 buildings.
So how do you choose what buildings to inspect when you’ve got limited resources, in terms of people and time? One of the key recommendations out of the CDA report was to prioritize inspections based on the risk of a fire or life safety incident occurring in a particular building. We want to optimize resource allocation and target areas where we can have the greatest impact by creating greater efficiencies. That’s a basic tenet of good stewardship of municipal resources regardless of budgets and funding.
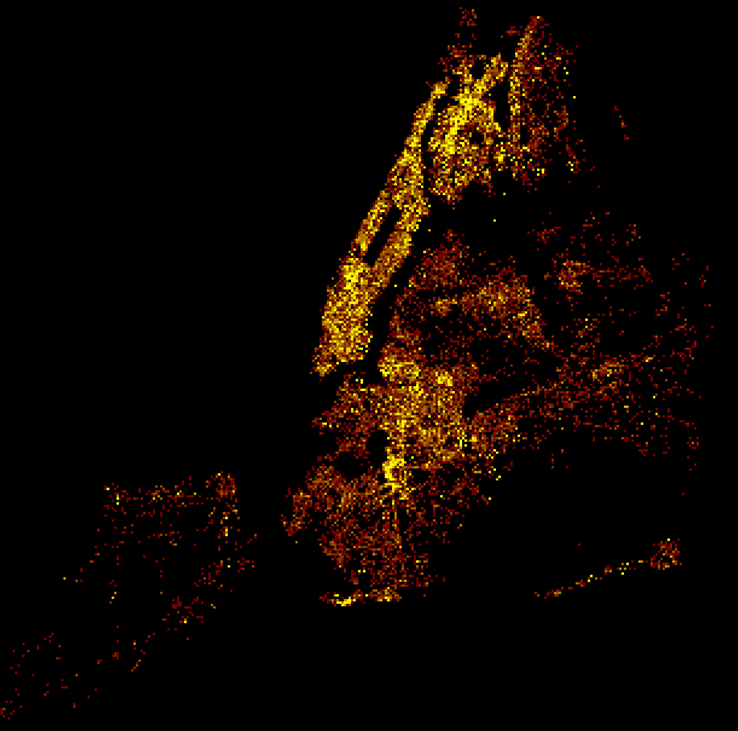
With this in mind, we started to build the Coordinated Building Inspection and Data Analysis System (CBIDAS), which is essentially a digital warehouse that consolidates data from multiple City sources that we can then leverage in different applications. FireCast is one such application: it pulls building data through an algorithm we’ve written that assigns every building with a score that denotes how likely we think it is to have a fire. And then it ranks the buildings. We’ve also developed an application called the Risk Based Inspection System (RBIS), and that’s how FDNY field units receive the FireCast information. When an officer logs in, they are given an inspection list developed through FireCast, and they can also access a profile for each building with its history, square footage, number of floors, and any notes captured from previous inspections.
How long has the department been using this approach, and how does the algorithm identify risk?
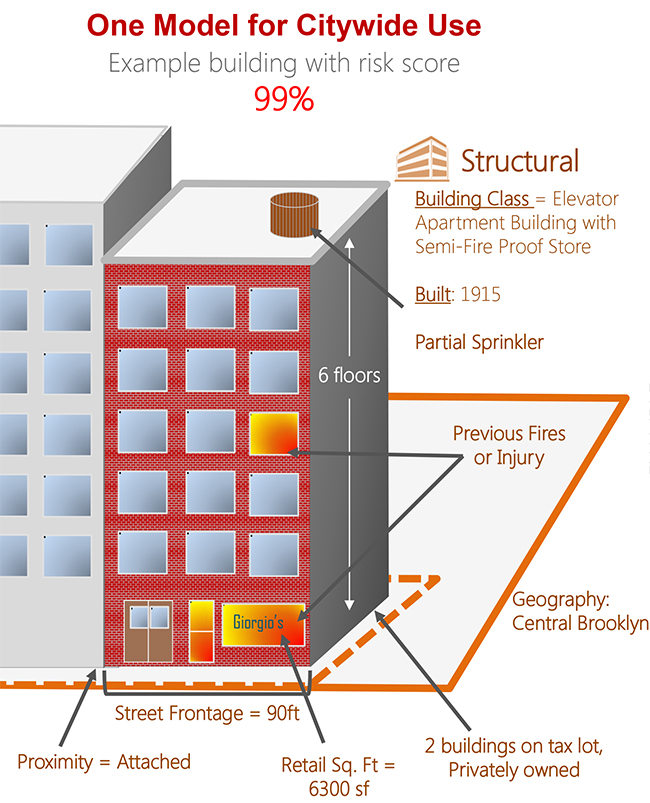
We deployed RBIS citywide in March 2013. It had a model based on some simple data variables. I was still building the analytics unit at that point — it’s only a year old. When the unit was up and running, we quickly released FireCast 2.0, which is our current, operational model. It uses 13 factors, each of which has multiple potential variables. These factors are largely building characteristics: building class; use; age; the fire code the building was built under; previous history of fire; whether it’s attached, semi-attached, or detached; the amount of retail space; the number of buildings on that tax lot; and location. There are some specific variables that have a particularly interesting correlation with fire events. But we’ve found that these variables are usually proxies for negligence of a building or people’s behavior.
In developing our third iteration, which we’ve been working on for the last year and will deploy later this summer, we began by examining close to 7,500 factors, mainly drawn from our department, the Department of City Planning, the Department of Buildings, the Department of Environmental Protection, and 311 complaints. We ultimately whittled that down to just under 1,000 factors that feed into the final algorithm. FireCast 3.0 notably brings in what we call behavioral cues and violation activity. The latter includes things that might tell you that a building isn’t well maintained or that the owner is not acting in accordance with regulations: sidewalk cleanliness, illegal alterations, et cetera. Behavioral cues include things like 311 noise complaints or rodent problems. If you have higher rates of those in an area, we calculate that the risk of a building having a fire or a life safety incident goes up.
With this new model, we’re also creating a risk profile for every Battalion in the city. When you begin to chart the buildings within an area, you see how risk scores change over time. There’s generally a strand of buildings that remain risky all the time, and then another strand that remain relatively unrisky. But for those middle buildings, behavioral cues or violation activity turn them on and off in terms of riskiness. This could, in part, be seasonal: during summer people stay late at bars and that feeds into noise complaints. That might be an indicator of people’s behavior, and some behavior leads to fires. But it’s not clear for each individual variable.
What are the challenges of making sure this data is being used effectively? What are some best practices you’ve identified during this process?
Consuming other City agencies’ data introduces some real complexities. We found that the purpose for which a particular piece of data was gathered by the other agency matters, because that may be very different from the reason that we want it. For example, when the Department of Finance uses addresses to identify a building, they are mainly concerned with where the tax bill is going to go, whereas we want an address to tell us what building to go into to fight a fire or do an inspection.
One thing we’ve done well throughout the process has been to convene a stakeholder group that involved everyone in the department with a role in creating or using the applications. RBIS is very much the field operation’s application, and they’ve been at the table along the way and have really directed the development. The field operation is also responsible for driving the implementation of the project citywide. There was the technology roll out, but we also had to train more than 3,000 fire officers on how to use the application. Last fall, we also deployed supplemental task forces to areas with a high volume of risky buildings to ensure that they had been inspected and we were familiar with those buildings.
In using data from other agencies on a daily basis, you also need to create feedback mechanisms. We have eyes and ears on the ground that can observe, for example, Department of City Planning data through our system, and if they find an error — a building is noted as having three stories when it clearly has two — they can update the record. We’ve created ways to do that. As a result of that feedback, anyone else who uses City Planning data will have more up-to-date records. In some sense, we’ve unintentionally given the City agencies that gather the data ground inspectors that can check and update their data.
I also think there’s an opportunity for greater partnership with academic institutions, and we welcome that. We work with NYU’s Center for Urban Science and Progress, and we hope to learn as much as we can from them.
The fire department is clearly focused on fire prevention and fighting, but you also provide emergency health services, among other things. How can the principles of FireCast extend into the rest of the FDNY’s work?
We have a number of key projects, some similar to FireCast, where you are using particular analytics to choose or prioritize different things to treat a problem. We’ve been asked to do some work in recruitment and diversity, so we’re analyzing the different types of events through which we actively recruit and seeing where we receive the most diverse cross section of applicants. We’re also trying to build a model that would help us identify a flu outbreak in the city based on related calls to EMS or 911. For Vision Zero, which is a priority agenda for the new mayor, we’re using EMS data from when a pedestrian is struck by a vehicle to identify hot spots or target intersections that are particularly dangerous, and then feeding that information into the City’s overall strategy for reducing traffic fatalities.
This project fits squarely within the “big data” trend — what’s your perspective on the wider move toward using data to drive governmental decision-making?
As an unofficial data guy, I’m very excited. But the field is still in its infancy. Computers have only been around from an operational standpoint since the early ‘90s, and even later in government in some cases. It also takes time to build data sets that you can actually call big data. The fact that we have 15 years of data ripe for analysis and mining is a new phenomenon, but it’s an exciting one. I think as we continue to dig into the data we’ll realize that there’s so much we can learn about ourselves, both in terms of prioritizing resource allocation and helping to identify what questions we should be asking. Sometimes you don’t know a trend is occurring until you see it in the data.
City government is also pushing an open data initiative now, and we hope to release some of our data sets next January. That’s something I’m particularly excited about, because making it more transparent, more available, will allow the public to pinpoint notable trends or create tools that we may not have thought of. And we at the fire department see releasing our data as part of the initiative as another chance to lead.
We’ve also offered to work with other city governments or fire services to show them what we’ve done with FireCast. Our algorithm is somewhat specific to the data that we have, but the methodology could be applied to any set. A lot of city governments are doing something similar but in a more basic form. We have a huge, systematized application, but a process for measuring risk could be as simple as a spreadsheet that ranks things based on what you think are risky characteristics.
The FDNY is one of the first City agencies to build an analytics units, and that’s a testament to our leadership and its openness to using data to inform our decision-making. Different City agencies have different capacities for analytics, but I think the public sector is beginning to see how data analysis can benefit decision-making. So I think we will continue to see these teams pop up across all sorts of City agencies. There are structural challenges, it’s costly, and it takes time, but I’m very excited about how this work can help us be better stewards of our resources.
The views expressed here are those of the authors only and do not reflect the position of The Architectural League of New York.
Conversations with public servants illuminate the complex workings of city government and how local agencies shape the physical and lived experience of the city.
Comments